Nim代码的文档化、分析和调试指南
02 October 2017 Dominik Picheta

|
这一小篇手册最初是为了
Nim in Action写的。
由于篇幅限制,书中并没有收录。 Nim in Action 的编写方式和这个指南很类似, 你可以把这本书买来(或找来)看看, 以便更加深入地了解 Nim 语言。
|
本手册将会和你一起探讨一些实用的工具, 用以文档化、分析和调试 Nim 代码。 我将会介绍如下内容:
-
在 Nim 的文档注释中使用的 reStructuredText 语言(RST)
-
Nim 性能和内存使用情况分析器
-
将 GDB/LLDB 与 Nim 一起使用
请务必准备好 nim 编译器, 并按照本指南中的说明进行操作, 以便达到最佳效果。
1. 代码文档化
给代码写注释和文档非常重要! 尤其是在直接查看库的 api 甚至软件的源码时。 它能够解释软件中一些可能不是很明显细节,
有很多种方式来达到这个效果。 比如你可能已经知道了, Nim 像很多语言那样支持注释。 注释是源码的说明解释, 让代码能更容易地被理解。
在nim中,单行注释由井号 # 分隔。
多行注释由 #[ and ]# 包裹起来。
在代码 1.1 中,分别进行了这两者的示例。
var x = 5 # Assign 5 to x.
#[multi-
  line      (1)
comment]#| 1 | 这种语法还算是挺新的,所以一般都不会支持 Nim 的语法高亮。 |
Nim 也提供了一种叫做 "文档注释" 的特殊注释类型。
这种类型的注释由nim的文档生成器处理。
只要用两个井号 ## 写的注释都是文档注释。
## 这是``test`` 模块的 *文档注释* .代码 1.2 展示了一个非常简单的文档注释
Nim 编译器包含了一个能给指定模块生成文档的命令。
实际代码在 代码 1.2 中,
比如说你电脑里有个 test.nim ,然后你可以执行 nim doc test.nim。
一般会在你的 test.nim 文件旁边生成一个 test.html。
在你最爱的那个浏览器中打开它,就能看到生成出来的 HTML
就像 图 1.1 中的截图这样:

test.nim 模块生成的文档注意截图和你看到的文本样式可能会有差异,请以实际效果为准:)。
"documentation comment"这俩字是斜体的,
因为在文档注释中是用星号(*)包裹起来的。
而 "test" 是用两个反引号包起来的,
这样能显得字体是等距的,
在讨论诸如变量名之类的标识符时很有用。
这些特殊的符号是文档生成器支持的 reStructuredText 标记语言的一小部分玩法。 文档生成器先解读你在命令行中指定的文件, 然后找到并逐一检查其中的所有文档注释。 每个文档注释都被 reStructuredText 解析器所解析。 然后文档生成器基于他解析的 reStructuredText 标记生成 HTML。
表 1.1列出了 reStructuredText 的一些语法。
| 语法 | 效果 | 用途 |
|---|---|---|
|
斜体 |
不明显地强调 |
|
粗体 |
明显强调 |
|
|
用于标识出 变量、过程 之类的名字. |
|
链接到其他网页 |
|
|
|
|
echo("Hello World")
|
|
用来展示示例代码。这将为指定的代码添加语法突出显示。 |

更全面的参考,请查看以下链接: http://sphinx-doc.org/rest.html
接下来我们再看个例子。
## 这是世界上最好的模块!
## 我们有一大堆文档!
##
##
## 示例
## ========
##
## 下面给你看几个例子:
##
##
## 把俩数加起来
## ---------------------------
##
## .. code-block:: nim
##
##   doAssert add(5, 5) == 10
##

proc add*(a, b: int): int =
  ## integer 类型的 ``a`` 加上 integer 类型的 ``b`` 然后返回运算结果。
return a + b-
代码 1.3 生成的文档 image::ch05_math_docs.png[]
从 代码 1.3 中的示例可以看出, 文档注释可以放在很多地方。
它们可以在全局作用域内,也可以在过程的局部作用域内。 在过程文档下的文档注释中,说明该过程的用途, Nim 文档生成器Nim文档生成器会生成模块中导出的所有过程的列表, 写了文档注释的的文档将会被显示在下面, 就像 图 1.2中那样。
这就是Nim标准库中使用注释和生成文档的方式。 有关如何使用注释和生成文档的更多实例,请查看 它的源码].
2. 分析代码
分析 应用,是指在应用运行时对其进行分析,以确定其所花费的时间。 像:它在哪个过程中花费时间最多啦、或者每个过程被调用了多少次之类的。 这些数值可以帮助你找到需要优化的代码区域。 有时它们还可以帮助您在应用程序中发现错误。
Nim 语言其实有很多很多能用的分析器。 挺惊人吧?毕竟 Nim 还是一门挺新的语言。 其实吧,这里的大多数分析器并不是专门给 Nim 创建的,而是给 C 。 C 分析器支持 Nim 应用,因为 Nim 可以编译为 C 。 要想用好这些分析器,你只需要了解这几件事。
事实上 Nim 编译器包含了一个探查器, 它是目前来说唯一一个用于对 Nim 应用程序进行性能分析的分析器。 在转到 C 分析器之前,让我们看一下它。
2.1. 使用 nimprof 进行性能分析
嵌入式堆栈跟踪分析器(ESTP)(有时也称为 NimProf)是标准 Nim 发行版中附带的 Nim 分析器。 要激活这个分析器,您只需执行以下步骤:
-
在你的程序的 Nim 主模块(将要编译的模块)中导入
nimprof模块, -
使用
--profiler:on和stacktrace:on标志编译程序。 -
正常运行它。
|
应用速度
分析你的应用程序时,运行速度会变慢,
这是因为分析器需要在运行时分析应用程序的执行情况,
这会带来明显的开销。
|
看一眼下面的代码。
import nimprof (1)
import strutils (2)

proc ab() =
  echo("Found letter")

proc num() =
  echo("Found number")

proc diff() =
  echo("Found something else")

proc analyse(x: string) =
  var i = 0
  while true:
    case x[i] (3)
    of Letters: ab()
    of {'0' .. '9'}: num()
    of '\0': break (4)
    else: diff()
    i.inc

for i in 0 .. 10000: (5)
analyse("uyguhijkmnbdv44354gasuygiuiolknchyqudsayd12635uha")| 1 | 有了 nimprof 模块,探查器才能正常工作,所以该模块至关重要。 |
| 2 | strutils 模块定义了 Letters 集合. |
| 3 | 字符串 x 中的每个字符都被遍历,如果这个字符是字母,那么调用 ab ;
如果是数字,就调用 num ;
其他情况调用 diff 。 |
| 4 | \0 表示到了字符串的结尾,我们在这停止循环。 |
| 5 | 为了使 Profiler 的结果更加可靠,我们进行了1万次分析。 |
将其另存为 main.nim ,
然后通过执行 nim c --profiler:on --stacktrace:on main.nim 来编译。
这个例子应该能成功编译。 然后,你可以运行它。
程序执行完毕后,您应该在终端窗口中看到一条类似于"writing profile_results.txt…"的消息。
main 程序会在你当前的工作目录中创建一个 profile_results.txt 文件,
文件的内容看起来应该和
代码 1.5差不多
total executions of each stack trace:
Entry: 1/4 Calls: 89/195 = 45.64% [sum: 89; 89/195 = 45.64%]
  analyse 192/195 = 98.46%
  main 195/195 = 100.00%
Entry: 2/4 Calls: 83/195 = 42.56% [sum: 172; 172/195 = 88.21%]
  ab 83/195 = 42.56%
  analyse 192/195 = 98.46%
  main 195/195 = 100.00%
Entry: 3/4 Calls: 20/195 = 10.26% [sum: 192; 192/195 = 98.46%]
  num 20/195 = 10.26%
  analyse 192/195 = 98.46%
  main 195/195 = 100.00%
Entry: 4/4 Calls: 3/195 = 1.54% [sum: 195; 195/195 = 100.00%]
  main 195/195 = 100.00%
在应用程序运行时,分析器会为当前正在执行的代码行拍摄多个快照。
它记录了应用程序最终如何执行那段代码堆栈跟踪。
然后记录在最常见的路径 profile_results.txt 中。
在 代码 1.5 所示的报告中,
分析器制作了195个快照。
它发现正在执行的过程 analyse 中的代码行在那些快照中占了45.64%。
42.56%的快照调用了 ab 过程,没毛病,因为传递给 analyse 的字符串主要由字母组成。
数字没那么多,所以 num 过程的执行仅占了这些快照的10.26%。
分析器没有监测到 diff 过程的调用,因为在字符串 x 中没有其他字符。
试着在传递给 analyse 过程的字符串中添加一些标点符号,
你会发现分析器监测到并显示出来了 diff 过程。
在不使用分析器的情况下,很容易确定 代码 1.4 中大部分程序处理了的位置。 但是对于更复杂的模块和应用,Nim Profiler 非常适合确定哪些程序最常用。
|
内存使用情况
Nim 分析器也可用于测量内存使用情况,
只需要使用`--profiler:off`、--stackTrace:on、和 -d:memProfiler 标志编译你的应用即可。
|
2.2. 使用 Valgrind 进行分析
不幸的是,分析器不都是跨平台的。 Valgrind 就是一个例子, 因为它并不支持 Windows 。
Valgrind 不只是一个分析器, 它是一个主要用来调试内存和检测内存泄漏的工具。 分析器组件叫做 Callgrind,它分析你的应用调用了哪些过程,以及这些过程之后的调用,依此类推。
叫做 KCacheGrind 的应用可以把 Callgrind 的结果可视化地输出出来。
|
安装 Valgrind
要使用此处的示例,您将需要将 Valgrind 工具与 KCacheGrind 一起安装。
如果您使用的是 Linux,很有可能操作系统上已经安装了这些工具。
在 Mac OS X 上,你可以简单地通过执行下面的代码来安装
brew install valgrind QCacheGrind.
|
让我们在 listing 1.4 中列出的应用中试一下 Valgrind 吧。
首先通过运行来重新编译没有任何标志的应用程序 nim c main。
你需要注释掉 main.nim 文件中的 import nimprof 这一行,才能成功完成此操作。
然后,执行以下命令,在 Valgrind 下运行刚才的应用: valgrind --tool=callgrind -v ./main
callgrind 工具比 Nim 分析器增加了更大的开销,
因此您可能需要终止应用程序,
可以通过同时按 Control 和 C 键来安全地终止应用程序。
callgrind工具提供的文本输出非常大, 因此想直接在文本编辑器中查看所有内容是不切实际的。
Thankfully a tool exists to allow us to explore it visually. This tool is called KCacheGrind (QCacheGrind on Mac OS X). You can execute it in the directory where you executed Valgrind to get something similar to the screenshot in figure 1.3.
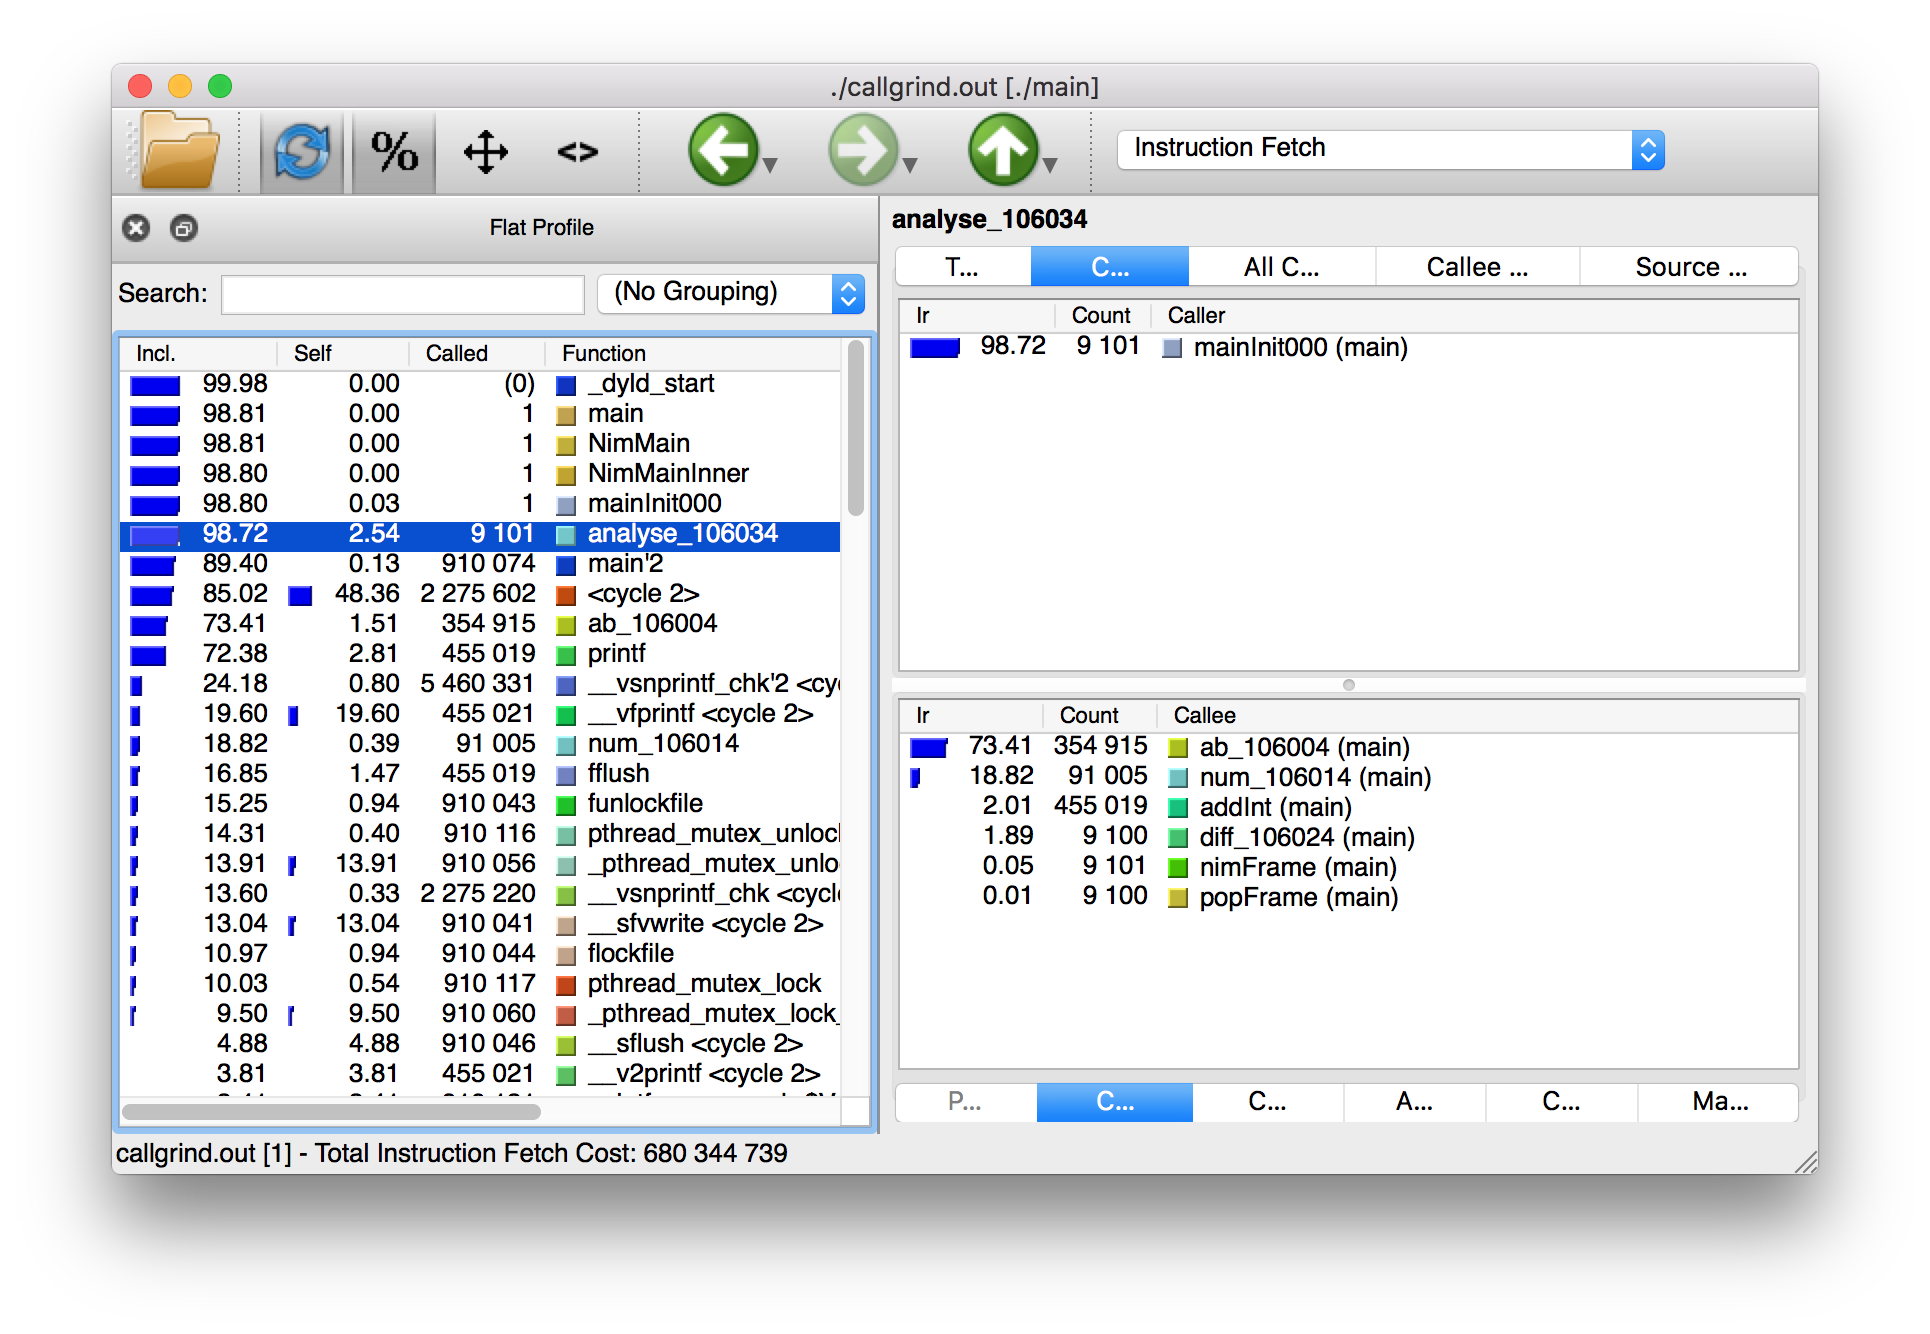
The results of the Callgrind tool show many more calls during the lifetime of listing 1.4. This is because many of the C functions, which have been defined by Nim, during the translation to C are now visible. These functions are necessary to implement the behaviour of the code in listing 1.4.
The C function which is selected in the screenshots corresponds to the
analyse Nim procedure. Procedures' names undergo a process called name
mangling when translated to C functions, this prevents clashes between other
C functions. The name mangling process currently just adds an underscore
followed by a number to the C function name. Thankfully figuring out which
C functions correspond to which Nim procedures is still easy.
The output from Callgrind gives you more low-level details about the execution of your Nim applications. 图 1.3 shows the number of times every single C function has been executed, it allows you to diagnose performance problems which may be outside your control. But with greater power comes greater complexity so Valgrind has a higher learning curve than the Nim profiler.
3. Debugging Nim code
Debugging is one of the most important activities in software development. Bugs in software occur inadvertantly. When a user reports an issue with your software, how do you fix it?
The first step is to reproduce the issue. After that debugging tools help to diagnose the issue and to figure out its root cause.
Nim does many things to make debugging as easy as possible. For example it ensures that detailed and easy to understand stack traces are reported whenever your application crashes. Consider the following code in listing 1.6.
import strutils (1)
let line = stdin.readLine() (2)
let result = line.parseInt + 5 (3)
echo(line, " + 5 = ", result) (4)| 1 | The strutils module defines the parseInt procedure. |
| 2 | Read a line from the standard input. |
| 3 | The string line is converted into an integer, the number 5 is then
added to that integer. |
| 4 | Display the result of the calculation. |
This code is fairly simple. It reads a line of text from the standard input,
converts this line into an integer, adds the number 5 to it and displays
the result. Save this code as adder.nim and compile it by executing
nim c adder.nim, then execute the resulting binary. The program will
wait for your input, once you type in a number you will see the sum of 5
and the number you typed in. But what happens when you don’t type in a number?
Type in some text and observe the results. You should see something similar
to the output in listing 1.7 below.
ValueError exceptionTraceback (most recent call last)
adder.nim(3) adder (1)
strutils.nim parseInt (2)
Error: unhandled exception: invalid integer: some text [ValueError] (3)| 1 | The program was executing line 3 in the adder module… |
| 2 | … followed by the parseInt procedure which raised the ValueError
exception. |
| 3 | This is the exception message followed by the exception type in square brackets. |
The program crashed because an exception was raised and it was not caught
by any try statements. This resulted in a stack trace being displayed and
the program exiting. The stack trace in listing 1.7 is
very informative,
it leads directly to the line which caused the crash. After the adder.nim
module name, the number 3 points to the line number
in the adder module. This line is highlighted in
listing 1.8 below.
import strutils
let line = stdin.readLine()
let result = line.parseInt + 5
echo(line, " + 5 = ", result)
The parseInt procedure cannot convert strings containing only letters
into a number because no number exists in that string. The exception message
shown at the bottom of the stack trace informs us of this. It includes
the string value that parseInt attempted to parse which gives further hints
about what went wrong.
You may not think it but program crashes are a good thing when it comes to debugging. The truly horrible bugs are the ones which produce no crashes, but instead result in your program producing incorrect results. In such cases advanced debugging techniques need to be used. Debugging also comes in handy when a stack trace does not give enough information about the issue.
The primary purpose of debugging is to investigate the state of memory
at a particular point in the execution of your program. You may for example
want to find out what the value of the line variable is just before
the parseInt procedure is called. This can be done in many ways.
3.1. Debugging using echo
By far the simplest and most common approach is to use the echo
procedure. The echo
procedure allows you to display the value of most variables, as long as the
type of the variable implements the $ procedure it can be displayed.
For other variables the repr procedure can be used, you can pass any
type of variable to it and get a textual representation of that
variable’s value.
Using the repr procedure and echo, let’s investigate the value of the
line variable just before the call to parseInt.
line variable using repr.import strutils
let line = stdin.readLine()
echo("The value of the line variable is: ", repr(line))
let result = line.parseInt + 5
echo(line, " + 5 = ", result)The repr procedure is useful because it shows non-printable characters
in their escaped form. It also shows extra information about many types of
data. Running the example in listing 1.9 and typing in 3 Tab
characters results in the following output.
The value of the `line` variable is: 0x105ff3050"\9\9\9"
Traceback (most recent call last)
foo.nim(4)               foo
strutils.nim             parseInt
Error: unhandled exception: invalid integer:       [ValueError]
The exception message just shows some whitespace which is how Tab characters
are shown in normal text. But you have no way of distinguishing whether
that whitespace is just normal space characters or whether it is in fact a
multiple Tab characters. The repr procedure solves this ambiguity by showing
\9\9\9, the number 9 is the ASCII number code for the tab character.
The memory address of the line variable is also shown.
3.2. Using writeStackTrace
An unhandled exception is not the only way for a stack trace to be displayed. You may find it useful to display the current stack trace anywhere in your program for debugging purposes. This can give you vital information, especially in larger programs with many procedures, where it can show you the path through those procedures and how your program’s execution ended in a certain procedure.
Consider the following example.
writeStackTrace exampleproc a1() =
writeStackTrace()
proc a() =
a1()
a()Compiling and running this example will display the following stack trace.
Traceback (most recent call last)
foo.nim(7)               foo
foo.nim(5)               a
foo.nim(2)               a1
The a procedure is called first on line 7, followed by a1 at line 5,
and finally the writeStackTrace procedure is called on line 2.
3.3. Using GDB/LLDB
Sometimes a proper debugging tool is necessary for the truly complicated issues. As with profiling tools in the previous section, Nim programs can be debugged using most C debuggers. One of the most popular debugging tools is the GNU Debugger, its often known by the acronym GDB.
The GNU debugger should be included with your distribution of gcc which you should already have as part of your Nim installation. Unfortunately on the latest versions of Mac OS X installation of gdb is problematic, but you can use a similar debugger called LLDB. LLDB is a much newer debugger, but it functions in almost exactly the same way.
Let’s try to use GDB (or LLDB if you’re on Mac OS X) to debug the small
adder.nim example introduced in listing 1.8.
I will repeat the example below.
adder.nim exampleimport strutils
let line = stdin.readLine()
let result = line.parseInt + 5
echo(line, " + 5 = ", result)In order to use these debugging tools you will need to compile adder.nim
with two additional flags. The --debuginfo flag, which will instruct the
compiler to add extra debugging information to the resulting binary. The
debugging information will be used by GDB and LLDB to read procedure names
and line numbers of the currently executed code.
And also the --linedir:on flag which will include Nim-specific debug
information
such as module names and Nim source code lines. GDB and LLDB will use the
information added by the --linedir:on flag to report Nim-specific module
names and line numbers.
Putting both of these together you should compile the adder module using the
following command: nim c --debuginfo --linedir:on adder.nim.
|
The
Newer versions of Nim support the --debugger:native flag--debugger:native flag which is
equivalent to specifying the --linedir:on and --debuginfo flags.
|
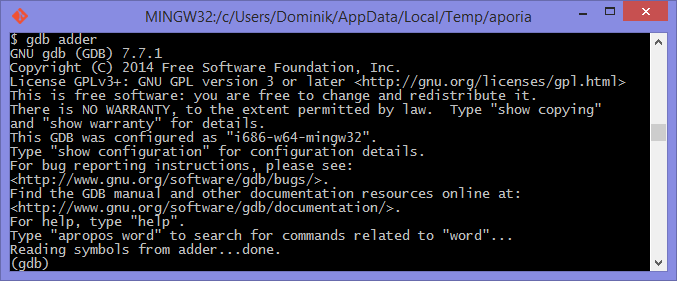
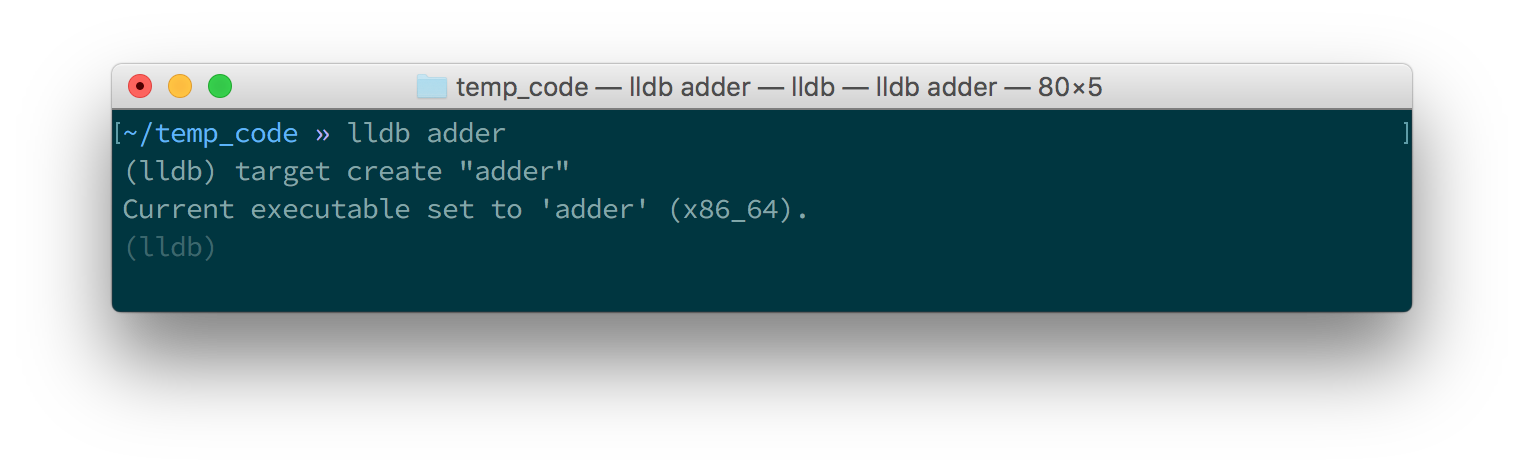
The next step is to launch the debugging tool. The usage of both of these tools
is very similar. To launch the adder executable in GDB execute gdb adder
and to launch it in LLDB execute lldb adder. GDB or LLDB should launch
and you should see something similar to figure 1.4
or figure 1.5.
Once these tools are launched they will wait for input from the user.
The input is in the form of a command. Both of these tools support a range
of different commands for controlling the execution of the program, to watch
the values of specific variables, to set breakpoints and much more. To get a
full list of supported commands type in help and press enter.
The aim for this debugging session is to find out the value of the line
variable, just like in the
previous sections. To do this we need to set a breakpoint at line 3 in the
adder.nim file. Thankfully, both GDB and LLDB share the same command syntax
for creating
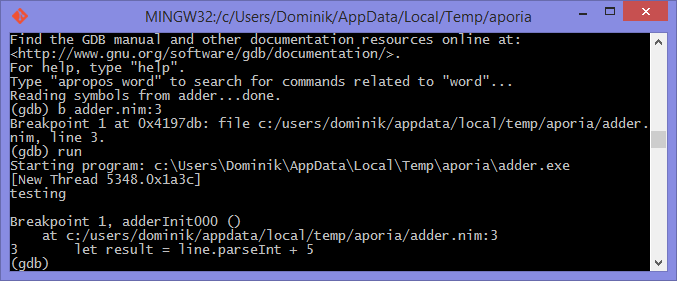
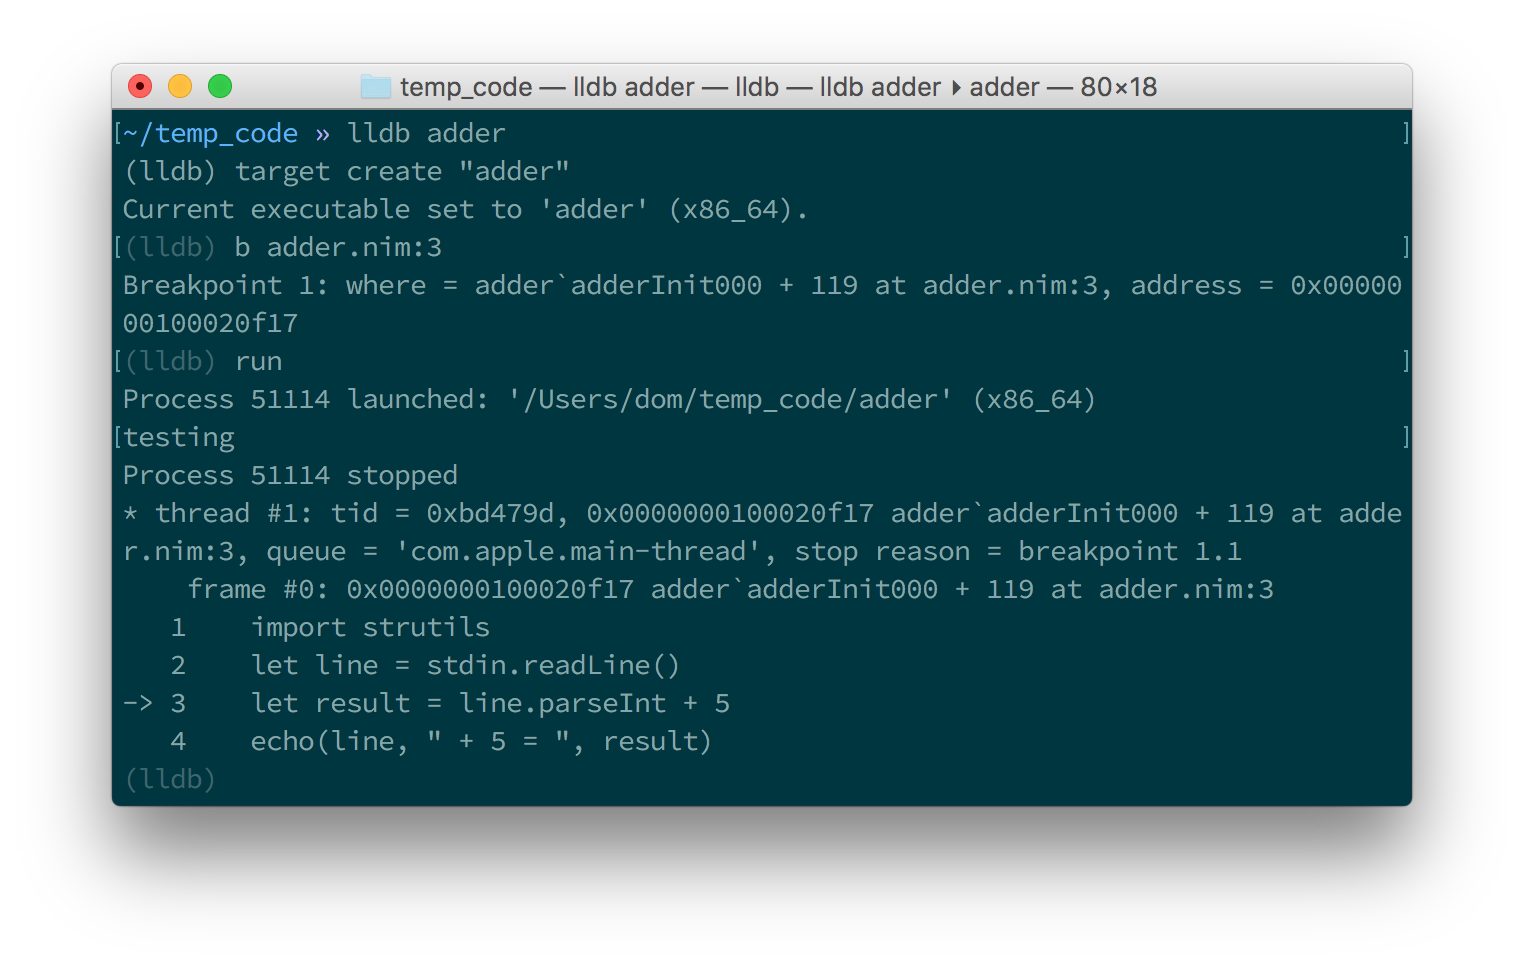
breakpoints. Simply type in b adder.nim:3 into the terminal and press enter.
A breakpoint should be successfully created, the debugger will confirm this
by displaying a message that is similar to 代码 5.23.
Breakpoint 1: where = adder`adderInit000 + 119 at adder.nim:3, address = 0x0000000100020f17Once the breakpoint is created, you can instruct the debugger to run the
adder program by using the run command. Type in run into the terminal
and press enter. The program won’t hit the breakpoint because it will first
read a line from standard input, so after you use the run command you will
need to type something else into the terminal. This time the adder program
will read it.
The debugger will then stop the execution of the program at line 3. Figures 1.6 and 1.7 show what that will look like.
At this point in the execution of the program, we should be able to display the
value of the line variable.
Displaying the value of a variable is the same in
both GDB and LLDB.
One can use the p (or print) command to display the value of any variable.
Unfortunately you cannot simply type in print line and get the result.
This is because of name mangling which I mentioned in the profiling section.
Before you can print out the value of the line variable you will need to
find out what the new name of it is. In almost all cases the variable name will
only have an underscore followed by a randomised number appended to it.
This makes finding the name rather trivial, but the process differs between
GDB and LLDB.
In GDB it is simple
to find out the name of the line variable, you can simply type in
print line_
and press the Tab button. GDB will then auto-complete the name for you, or give
you a list of choices.
As for LLDB, because it does not support auto-complete via the Tab key, this
is a bit more complicated. You need to find the name of the variable by looking
at the list of local and global variables in the current scope. You can get
a list of local variables by using the fr v -a
(or frame variable --no-args) command, and a list of global variables
by using the ta v (or target variable) command. The line variable is
a global variable so type in ta v to get a list of the global variables.
You should see something similar to the screenshot in figure 1.8.
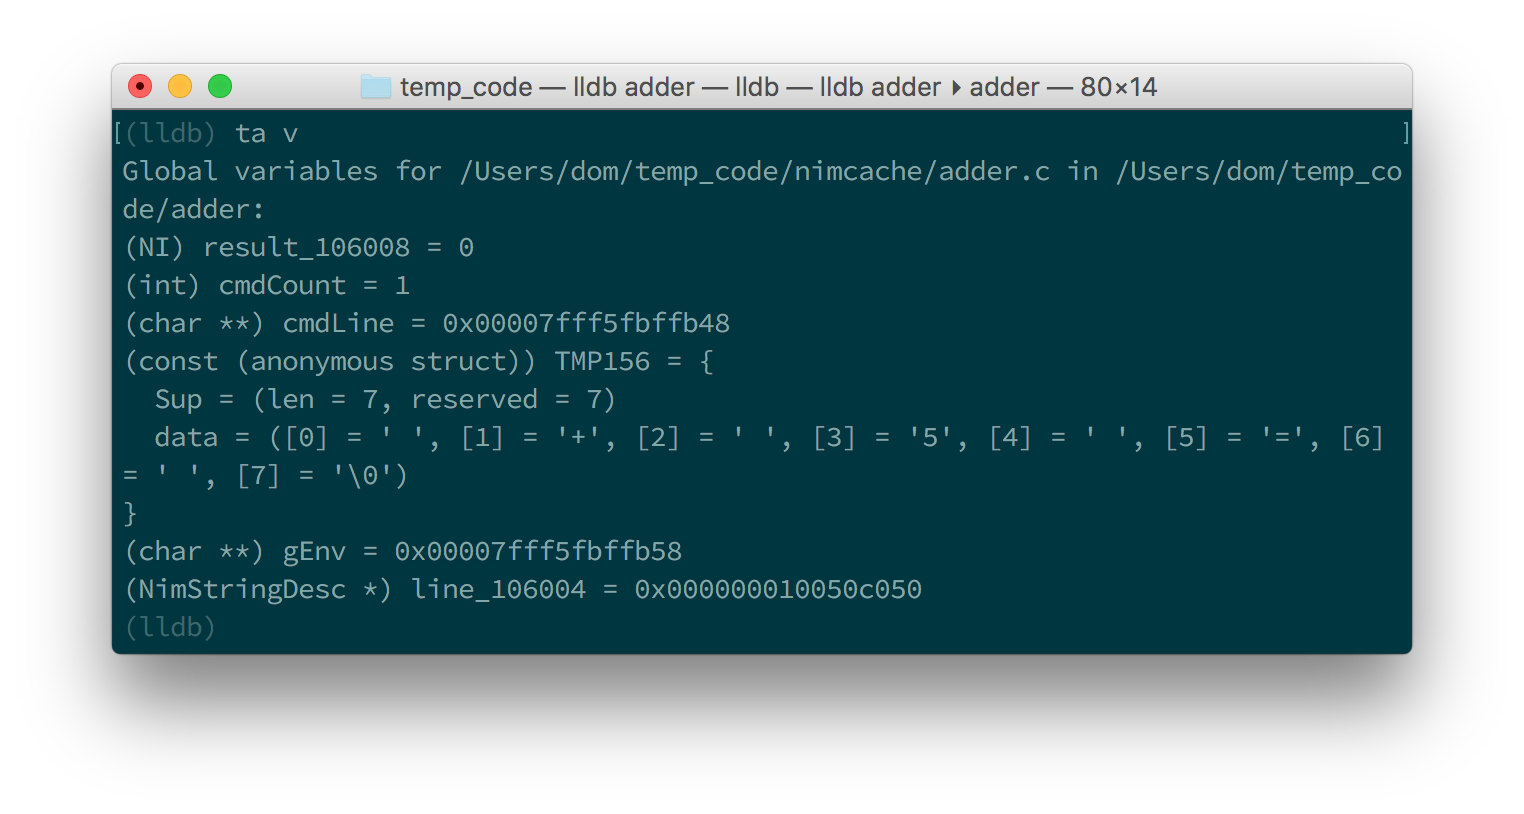
You can see the line variable at the bottom of the list as line_106004.
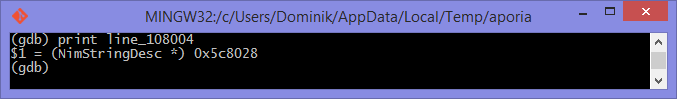
Now print the line variable by using the print <var_name_here> command,
make sure to replace the <var_name_here> with the name of the line variable
that you found from the previous step. Figures 1.9 and
1.10 show what you may see.
line variable in GDB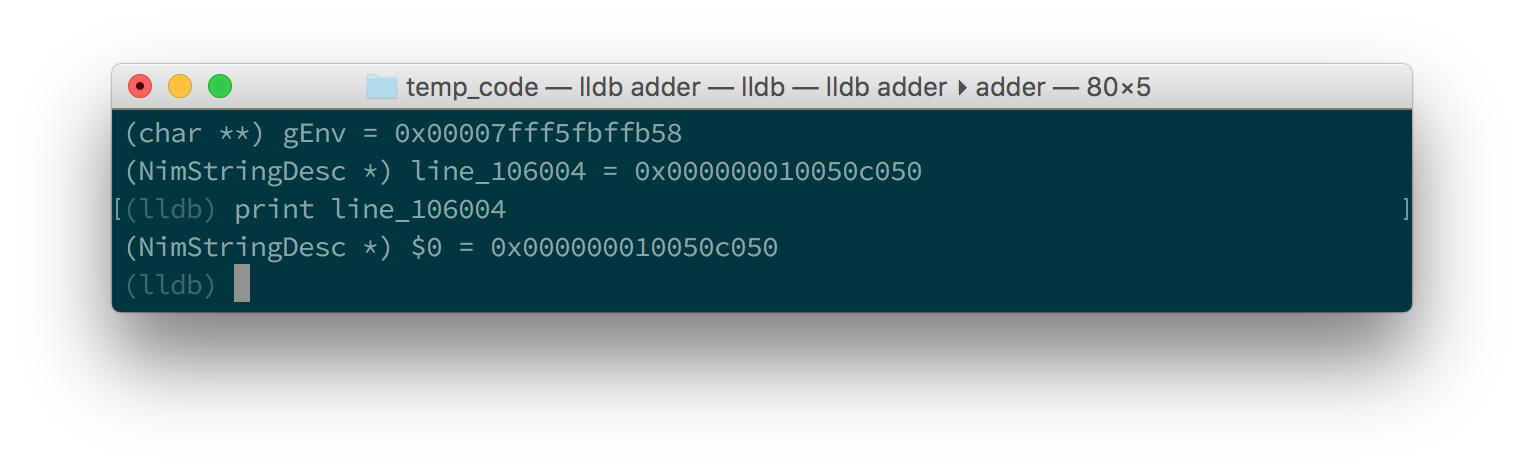
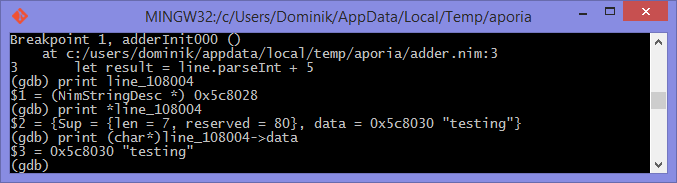
line variable in LLDBThis unfortunately tells us nothing about the value of the line variable.
We are in the land of low-level C, so the line variable is a pointer to
a NimStringDesc type. We can dereference this pointer by appending an
asterisk to the beginning of the variable name: print *line_106004.
Doing this will show values of each of the fields in the NimStringDesc
type. Unfortunately in LLDB this does not show the value of the data field,
so we must explicitly access it: print (char*)line_106004->data. The
(char*) is required to cast the data field into something which LLDB
can display. Figures 1.11 and 1.12
show what this looks like in GDB and LLDB respectively.
line variable in GDB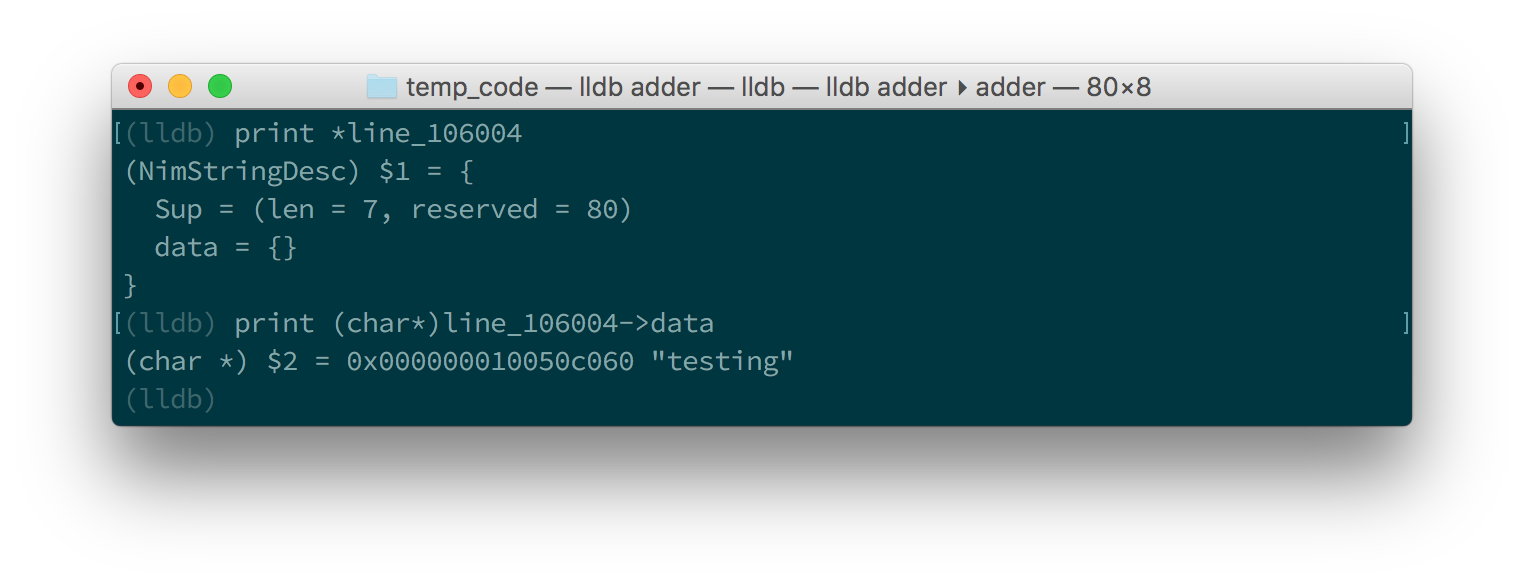
line variable in LLDBThis is much more complicated than simply using the echo procedure, but should
be useful for more complicated debugging scenarios. Hopefully this gave you
an idea of how to compile your Nim program so that it can
be debugged using GDB and LLDB. There are many more features that
these debuggers provide which are beyond the scope of this article. These
features allow you to analyse the execution of your program in many other
ways. You may wish
to learn more by looking at the many resources available online for these
debuggers and many others.
4. Conclusion
Thank you for reading. If you require help with these topics or anything else related to Nim, be sure to get in touch with our community.
author: Dominik Picheta excerpt: 本指南讨论了一些用于注释和生成文档、分析和调试nim代码的实用工具。 ---
= Nim代码的文档化、分析和调试指南 :figure-caption: Figure 1. :listing-caption: Listing 1. :table-caption: Table 1. :numbered: :toc: left

|
这一小篇手册最初是为了
Nim in Action写的。
由于篇幅限制,书中并没有收录。 Nim in Action 的编写方式和这个指南很类似, 你可以把这本书买来(或找来)看看, 以便更加深入地了解 Nim 语言。
|
本手册将会和你一起探讨一些实用的工具, 用以文档化、分析和调试 Nim 代码。 我将会介绍如下内容:
-
在 Nim 的文档注释中使用的 reStructuredText 语言(RST)
-
Nim 性能和内存使用情况分析器
-
将 GDB/LLDB 与 Nim 一起使用
请务必准备好 nim 编译器, 并按照本指南中的说明进行操作, 以便达到最佳效果。
== 代码文档化
给代码写注释和文档非常重要! 尤其是在直接查看库的 api 甚至软件的源码时。 它能够解释软件中一些可能不是很明显细节,
有很多种方式来达到这个效果。 比如你可能已经知道了, Nim 像很多语言那样支持注释。 注释是源码的说明解释, 让代码能更容易地被理解。
在nim中,单行注释由井号 # 分隔。
多行注释由 #[ and ]# 包裹起来。
在Listing 1.1 中,分别进行了这两者的示例。
var x = 5 # Assign 5 to x.
#[multi-
line (1)
comment]#| 1 | 这种语法还算是挺新的,所以一般都不会支持 Nim 的语法高亮。 |
Nim 也提供了一种叫做 "文档注释 的特殊注释类型。
这种类型的注释由nim的文档生成器处理。
只要用两个井号 ## 写的注释都是文档注释。
## 这是``test`` 模块的 *文档注释* .Listing 1.2 展示了一个非常简单的文档注释
Nim 编译器包含了一个能给指定模块生成文档的命令。
实际代码在 Listing 1.2 中,
比如说你电脑里有个 test.nim ,然后你可以执行 nim doc test.nim。
一般会在你的 test.nim 文件旁边生成一个 test.html。
在你最爱的那个浏览器中打开它,就能看到生成出来的 HTML
就像 Figure 1.1 中的截图这样:
test.nim 模块生成的文档注意截图和你看到的文本样式可能会有差异,请以实际效果为准:)。
"documentation comment"这俩字是斜体的,
因为在文档注释中是用星号(*)包裹起来的。
而 "test" 是用两个反引号包起来的,
这样能显得字体是等距的,
在讨论诸如变量名之类的标识符时很有用。
这些特殊的符号是文档生成器支持的 reStructuredText 标记语言的一小部分玩法。 文档生成器先解读你在命令行中指定的文件, 然后找到并逐一检查其中的所有文档注释。 每个文档注释都被 reStructuredText 解析器所解析。 然后文档生成器基于他解析的 reStructuredText 标记生成 HTML。
Table 1.1列出了 reStructuredText 的一些语法。 markup language.
| 语法 | 效果 | 用途 |
|---|---|---|
|
斜体 |
不明显地强调 |
|
粗体 |
明显强调 |
|
|
用于标识出 变量、过程 之类的名字. |
|
链接到其他网页 |
|
|
|
|
echo("Hello World")
|
|
用来展示示例代码。这将为指定的代码添加语法突出显示。 |
更全面的参考,请查看以下链接: http://sphinx-doc.org/rest.html
接下来我们再看个例子。
## 这是世界上最好的模块!
## 我们有一大堆文档!
##
##
## 示例
## ========
##
## 下面给你看几个例子:
##
##
## 把俩数加起来
## ---------------------------
##
## .. code-block:: nim
##
## doAssert add(5, 5) == 10
##
proc add*(a, b: int): int =
## integer 类型的 ``a`` 加上 integer 类型的 ``b`` 然后返回运算结果。
return a + b-
Listing 1.3 生成的文档 image::ch05_math_docs.png[]
从 Listing 1.3 中的示例可以看出, 文档注释可以放在很多地方。
它们可以在全局作用域内,也可以在过程的局部作用域内。 在过程文档下的文档注释中,说明该过程的用途, Nim 文档生成器Nim文档生成器会生成模块中导出的所有过程的列表, 写了文档注释的的文档将会被显示在下面, 就像 Figure 1.2中那样。
这就是Nim标准库中使用注释和生成文档的方式。 有关如何使用注释和生成文档的更多实例,请查看 它的源码].
== 分析代码
分析 应用,是指在应用运行时对其进行分析,以确定其所花费的时间。 像:它在哪个过程中花费时间最多啦、或者每个过程被调用了多少次之类的。 这些数值可以帮助你找到需要优化的代码区域。 有时它们还可以帮助您在应用程序中发现错误。
Nim 语言其实有很多很多能用的分析器。 挺惊人吧?毕竟 Nim 还是一门挺新的语言。 其实吧,这里的大多数分析器并不是专门给 Nim 创建的,而是给 C 。 C 分析器支持 Nim 应用,因为 Nim 可以编译为 C 。 要想用好这些分析器,你只需要了解这几件事。
事实上 Nim 编译器包含了一个探查器, 它是目前来说唯一一个用于对 Nim 应用程序进行性能分析的分析器。 在转到 C 分析器之前,让我们看一下它。
=== 使用 nimprof 进行性能分析
嵌入式堆栈跟踪分析器(ESTP)(有时也称为 NimProf)是标准 Nim 发行版中附带的 Nim 分析器。 要激活这个分析器,您只需执行以下步骤:
-
在你的程序的 Nim 主模块(将要编译的模块)中导入
nimprof模块, -
使用
--profiler:on和stacktrace:on标志编译程序。 -
正常运行它。
|
应用速度
分析你的应用程序时,运行速度会变慢,
这是因为分析器需要在运行时分析应用程序的执行情况,
这会带来明显的开销。
|
看一眼下面的代码。
import nimprof (1)
import strutils (2)
proc ab() =
echo("Found letter")
proc num() =
echo("Found number")
proc diff() =
echo("Found something else")
proc analyse(x: string) =
var i = 0
while true:
case x[i] (3)
of Letters: ab()
of {'0' .. '9'}: num()
of '\0': break (4)
else: diff()
i.inc
for i in 0 .. 10000: (5)
analyse("uyguhijkmnbdv44354gasuygiuiolknchyqudsayd12635uha")| 1 | 有了 nimprof 模块,探查器才能正常工作,所以该模块至关重要。 |
| 2 | strutils 模块定义了 Letters 集合. |
| 3 | 字符串 x 中的每个字符都被遍历,如果这个字符是字母,那么调用 ab ;
如果是数字,就调用 num ;
其他情况调用 diff 。 |
| 4 | \0 表示到了字符串的结尾,我们在这停止循环。 |
| 5 | 为了使 Profiler 的结果更加可靠,我们进行了1万次分析。 |
将其另存为 main.nim ,
然后通过执行 nim c --profiler:on --stacktrace:on main.nim 来编译。
这个例子应该能成功编译。 然后,你可以运行它。
程序执行完毕后,您应该在终端窗口中看到一条类似于"writing profile_results.txt…"的消息。
main 程序会在你当前的工作目录中创建一个 profile_results.txt 文件,
文件的内容看起来应该和
Listing 1.5差不多
total executions of each stack trace:
Entry: 1/4 Calls: 89/195 = 45.64% [sum: 89; 89/195 = 45.64%]
analyse 192/195 = 98.46%
main 195/195 = 100.00%
Entry: 2/4 Calls: 83/195 = 42.56% [sum: 172; 172/195 = 88.21%]
ab 83/195 = 42.56%
analyse 192/195 = 98.46%
main 195/195 = 100.00%
Entry: 3/4 Calls: 20/195 = 10.26% [sum: 192; 192/195 = 98.46%]
num 20/195 = 10.26%
analyse 192/195 = 98.46%
main 195/195 = 100.00%
Entry: 4/4 Calls: 3/195 = 1.54% [sum: 195; 195/195 = 100.00%]
main 195/195 = 100.00%在应用程序运行时,分析器会为当前正在执行的代码行拍摄多个快照。
它记录了应用程序最终如何执行那段代码堆栈跟踪。
然后记录在最常见的路径 profile_results.txt 中。
在 Listing 1.5 所示的报告中,
分析器制作了195个快照。
它发现正在执行的过程 analyse 中的代码行在那些快照中占了45.64%。
42.56%的快照调用了 ab 过程,没毛病,因为传递给 analyse 的字符串主要由字母组成。
数字没那么多,所以 num 过程的执行仅占了这些快照的10.26%。
分析器没有监测到 diff 过程的调用,因为在字符串 x 中没有其他字符。
试着在传递给 analyse 过程的字符串中添加一些标点符号,
你会发现分析器监测到并显示出来了 diff 过程。
在不使用分析器的情况下,很容易确定 Listing 1.4 中大部分程序处理了的位置。 但是对于更复杂的模块和应用,Nim Profiler 非常适合确定哪些程序最常用。
|
内存使用情况
Nim 分析器也可用于测量内存使用情况,
只需要使用`--profiler:off`、--stackTrace:on、和 -d:memProfiler 标志编译你的应用即可。
|
=== Profiling with Valgrind
Unfortunately in some cases profilers are not cross-platform. Valgrind is one of those cases, if you are a Windows user then I’m afraid you will not be able to use it.
Valgrind is not just a profiler, it is primarily a tool for memory debugging and memory leak detection. The profiler component is called Callgrind and it analyses procedures that your application calls and what those procedures then call and so on. An application called KCacheGrind can visualise output from Callgrind.
|
Installing Valgrind
To follow along with the examples here you will need to install the
Valgrind tool together with KCacheGrind. There is a chance these tools
are already installed on your operating system if you are using Linux.
On Mac OS X you can easily install them using Homebrew, just execute
brew install valgrind QCacheGrind.
|
Let’s try Valgrind on the example application in listing 1.4.
First recompile the
application without any flags by running nim c main. You
will need to comment out the import nimprof line in your main.nim file
to do this successfully.
You may then execute the following
command to run this application under
Valgrind: valgrind --tool=callgrind -v ./main
The callgrind tool adds an even bigger overhead than the Nim profiler so you may need to terminate the application, you can safely do so by pressing the Control and C keys together.
The textual output given by the callgrind tool is very large and so looking at it all in a text editor is impractical. Thankfully a tool exists to allow us to explore it visually. This tool is called KCacheGrind (QCacheGrind on Mac OS X). You can execute it in the directory where you executed Valgrind to get something similar to the screenshot in figure 1.3.
The results of the Callgrind tool show many more calls during the lifetime of listing 1.4. This is because many of the C functions, which have been defined by Nim, during the translation to C are now visible. These functions are necessary to implement the behaviour of the code in listing 1.4.
The C function which is selected in the screenshots corresponds to the
analyse Nim procedure. Procedures' names undergo a process called name
mangling when translated to C functions, this prevents clashes between other
C functions. The name mangling process currently just adds an underscore
followed by a number to the C function name. Thankfully figuring out which
C functions correspond to which Nim procedures is still easy.
The output from Callgrind gives you more low-level details about the execution of your Nim applications. Figure 1.3 shows the number of times every single C function has been executed, it allows you to diagnose performance problems which may be outside your control. But with greater power comes greater complexity so Valgrind has a higher learning curve than the Nim profiler.
== Debugging Nim code
Debugging is one of the most important activities in software development. Bugs in software occur inadvertantly. When a user reports an issue with your software, how do you fix it?
The first step is to reproduce the issue. After that debugging tools help to diagnose the issue and to figure out its root cause.
Nim does many things to make debugging as easy as possible. For example it ensures that detailed and easy to understand stack traces are reported whenever your application crashes. Consider the following code in listing 1.6.
import strutils (1)
let line = stdin.readLine() (2)
let result = line.parseInt + 5 (3)
echo(line, " + 5 = ", result) (4)| 1 | The strutils module defines the parseInt procedure. |
| 2 | Read a line from the standard input. |
| 3 | The string line is converted into an integer, the number 5 is then
added to that integer. |
| 4 | Display the result of the calculation. |
This code is fairly simple. It reads a line of text from the standard input,
converts this line into an integer, adds the number 5 to it and displays
the result. Save this code as adder.nim and compile it by executing
nim c adder.nim, then execute the resulting binary. The program will
wait for your input, once you type in a number you will see the sum of 5
and the number you typed in. But what happens when you don’t type in a number?
Type in some text and observe the results. You should see something similar
to the output in listing 1.7 below.
ValueError exceptionTraceback (most recent call last)
adder.nim(3) adder (1)
strutils.nim parseInt (2)
Error: unhandled exception: invalid integer: some text [ValueError] (3)| 1 | The program was executing line 3 in the adder module… |
| 2 | … followed by the parseInt procedure which raised the ValueError
exception. |
| 3 | This is the exception message followed by the exception type in square brackets. |
The program crashed because an exception was raised and it was not caught
by any try statements. This resulted in a stack trace being displayed and
the program exiting. The stack trace in listing 1.7 is
very informative,
it leads directly to the line which caused the crash. After the adder.nim
module name, the number 3 points to the line number
in the adder module. This line is highlighted in
listing 1.8 below.
import strutils
let line = stdin.readLine()
let result = line.parseInt + 5
echo(line, " + 5 = ", result)The parseInt procedure cannot convert strings containing only letters
into a number because no number exists in that string. The exception message
shown at the bottom of the stack trace informs us of this. It includes
the string value that parseInt attempted to parse which gives further hints
about what went wrong.
You may not think it but program crashes are a good thing when it comes to debugging. The truly horrible bugs are the ones which produce no crashes, but instead result in your program producing incorrect results. In such cases advanced debugging techniques need to be used. Debugging also comes in handy when a stack trace does not give enough information about the issue.
The primary purpose of debugging is to investigate the state of memory
at a particular point in the execution of your program. You may for example
want to find out what the value of the line variable is just before
the parseInt procedure is called. This can be done in many ways.
=== Debugging using echo
By far the simplest and most common approach is to use the echo
procedure. The echo
procedure allows you to display the value of most variables, as long as the
type of the variable implements the $ procedure it can be displayed.
For other variables the repr procedure can be used, you can pass any
type of variable to it and get a textual representation of that
variable’s value.
Using the repr procedure and echo, let’s investigate the value of the
line variable just before the call to parseInt.
line variable using repr.import strutils
let line = stdin.readLine()
echo("The value of the line variable is: ", repr(line))
let result = line.parseInt + 5
echo(line, " + 5 = ", result)The repr procedure is useful because it shows non-printable characters
in their escaped form. It also shows extra information about many types of
data. Running the example in listing 1.9 and typing in 3 Tab
characters results in the following output.
The value of the `line` variable is: 0x105ff3050"\9\9\9"
Traceback (most recent call last)
foo.nim(4) foo
strutils.nim parseInt
Error: unhandled exception: invalid integer: [ValueError]The exception message just shows some whitespace which is how Tab characters
are shown in normal text. But you have no way of distinguishing whether
that whitespace is just normal space characters or whether it is in fact a
multiple Tab characters. The repr procedure solves this ambiguity by showing
\9\9\9, the number 9 is the ASCII number code for the tab character.
The memory address of the line variable is also shown.
=== Using writeStackTrace
An unhandled exception is not the only way for a stack trace to be displayed. You may find it useful to display the current stack trace anywhere in your program for debugging purposes. This can give you vital information, especially in larger programs with many procedures, where it can show you the path through those procedures and how your program’s execution ended in a certain procedure.
Consider the following example.
writeStackTrace exampleproc a1() =
writeStackTrace()
proc a() =
a1()
a()Compiling and running this example will display the following stack trace.
Traceback (most recent call last)
foo.nim(7) foo
foo.nim(5) a
foo.nim(2) a1The a procedure is called first on line 7, followed by a1 at line 5,
and finally the writeStackTrace procedure is called on line 2.
=== Using GDB/LLDB
Sometimes a proper debugging tool is necessary for the truly complicated issues. As with profiling tools in the previous section, Nim programs can be debugged using most C debuggers. One of the most popular debugging tools is the GNU Debugger, its often known by the acronym GDB.
The GNU debugger should be included with your distribution of gcc which you should already have as part of your Nim installation. Unfortunately on the latest versions of Mac OS X installation of gdb is problematic, but you can use a similar debugger called LLDB. LLDB is a much newer debugger, but it functions in almost exactly the same way.
Let’s try to use GDB (or LLDB if you’re on Mac OS X) to debug the small
adder.nim example introduced in listing 1.8.
I will repeat the example below.
adder.nim exampleimport strutils
let line = stdin.readLine()
let result = line.parseInt + 5
echo(line, " + 5 = ", result)In order to use these debugging tools you will need to compile adder.nim
with two additional flags. The --debuginfo flag, which will instruct the
compiler to add extra debugging information to the resulting binary. The
debugging information will be used by GDB and LLDB to read procedure names
and line numbers of the currently executed code.
And also the --linedir:on flag which will include Nim-specific debug
information
such as module names and Nim source code lines. GDB and LLDB will use the
information added by the --linedir:on flag to report Nim-specific module
names and line numbers.
Putting both of these together you should compile the adder module using the
following command: nim c --debuginfo --linedir:on adder.nim.
|
The
Newer versions of Nim support the --debugger:native flag--debugger:native flag which is
equivalent to specifying the --linedir:on and --debuginfo flags.
|
The next step is to launch the debugging tool. The usage of both of these tools
is very similar. To launch the adder executable in GDB execute gdb adder
and to launch it in LLDB execute lldb adder. GDB or LLDB should launch
and you should see something similar to figure 1.4
or figure 1.5.
Once these tools are launched they will wait for input from the user.
The input is in the form of a command. Both of these tools support a range
of different commands for controlling the execution of the program, to watch
the values of specific variables, to set breakpoints and much more. To get a
full list of supported commands type in help and press enter.
The aim for this debugging session is to find out the value of the line
variable, just like in the
previous sections. To do this we need to set a breakpoint at line 3 in the
adder.nim file. Thankfully, both GDB and LLDB share the same command syntax
for creating
breakpoints. Simply type in b adder.nim:3 into the terminal and press enter.
A breakpoint should be successfully created, the debugger will confirm this
by displaying a message that is similar to Listing 5.23.
Breakpoint 1: where = adder`adderInit000 + 119 at adder.nim:3, address = 0x0000000100020f17Once the breakpoint is created, you can instruct the debugger to run the
adder program by using the run command. Type in run into the terminal
and press enter. The program won’t hit the breakpoint because it will first
read a line from standard input, so after you use the run command you will
need to type something else into the terminal. This time the adder program
will read it.
The debugger will then stop the execution of the program at line 3. Figures 1.6 and 1.7 show what that will look like.
At this point in the execution of the program, we should be able to display the
value of the line variable.
Displaying the value of a variable is the same in
both GDB and LLDB.
One can use the p (or print) command to display the value of any variable.
Unfortunately you cannot simply type in print line and get the result.
This is because of name mangling which I mentioned in the profiling section.
Before you can print out the value of the line variable you will need to
find out what the new name of it is. In almost all cases the variable name will
only have an underscore followed by a randomised number appended to it.
This makes finding the name rather trivial, but the process differs between
GDB and LLDB.
In GDB it is simple
to find out the name of the line variable, you can simply type in
print line_
and press the Tab button. GDB will then auto-complete the name for you, or give
you a list of choices.
As for LLDB, because it does not support auto-complete via the Tab key, this
is a bit more complicated. You need to find the name of the variable by looking
at the list of local and global variables in the current scope. You can get
a list of local variables by using the fr v -a
(or frame variable --no-args) command, and a list of global variables
by using the ta v (or target variable) command. The line variable is
a global variable so type in ta v to get a list of the global variables.
You should see something similar to the screenshot in figure 1.8.
You can see the line variable at the bottom of the list as line_106004.
Now print the line variable by using the print <var_name_here> command,
make sure to replace the <var_name_here> with the name of the line variable
that you found from the previous step. Figures 1.9 and
1.10 show what you may see.
line variable in GDB
line variable in LLDBThis unfortunately tells us nothing about the value of the line variable.
We are in the land of low-level C, so the line variable is a pointer to
a NimStringDesc type. We can dereference this pointer by appending an
asterisk to the beginning of the variable name: print *line_106004.
Doing this will show values of each of the fields in the NimStringDesc
type. Unfortunately in LLDB this does not show the value of the data field,
so we must explicitly access it: print (char*)line_106004->data. The
(char*) is required to cast the data field into something which LLDB
can display. Figures 1.11 and 1.12
show what this looks like in GDB and LLDB respectively.
line variable in GDB
line variable in LLDBThis is much more complicated than simply using the echo procedure, but should
be useful for more complicated debugging scenarios. Hopefully this gave you
an idea of how to compile your Nim program so that it can
be debugged using GDB and LLDB. There are many more features that
these debuggers provide which are beyond the scope of this article. These
features allow you to analyse the execution of your program in many other
ways. You may wish
to learn more by looking at the many resources available online for these
debuggers and many others.
== Conclusion
Thank you for reading. If you require help with these topics or anything else related to Nim, be sure to get in touch with our community.
title: Nim代码的文档化、分析和调试指南 author: Dominik Picheta excerpt: 本指南讨论了一些用于注释和生成文档、分析和调试nim代码的实用工具。 ---
Nim代码的文档化、分析和调试指南
|
|
这一小篇手册最初是为了
Nim in Action写的。
由于篇幅限制,书中并没有收录。 Nim in Action 的编写方式和这个指南很类似, 你可以把这本书买来(或找来)看看, 以便更加深入地了解 Nim 语言。
|
本手册将会和你一起探讨一些实用的工具, 用以文档化、分析和调试 Nim 代码。 我将会介绍如下内容:
-
在 Nim 的文档注释中使用的 reStructuredText 语言(RST)
-
Nim 性能和内存使用情况分析器
-
将 GDB/LLDB 与 Nim 一起使用
请务必准备好 nim 编译器, 并按照本指南中的说明进行操作, 以便达到最佳效果。
1. 代码文档化
给代码写注释和文档非常重要! 尤其是在直接查看库的 api 甚至软件的源码时。 它能够解释软件中一些可能不是很明显细节,
有很多种方式来达到这个效果。 比如你可能已经知道了, Nim 像很多语言那样支持注释。 注释是源码的说明解释, 让代码能更容易地被理解。
在nim中,单行注释由井号 # 分隔。
多行注释由 #[ and ]# 包裹起来。
在代码 1.1 中,分别进行了这两者的示例。
var x = 5 # Assign 5 to x.
#[multi-
  line      (1)
comment]#| 1 | 这种语法还算是挺新的,所以一般都不会支持 Nim 的语法高亮。 |
Nim 也提供了一种叫做 "文档注释" 的特殊注释类型。
这种类型的注释由nim的文档生成器处理。
只要用两个井号 ## 写的注释都是文档注释。
## 这是``test`` 模块的 *文档注释* .代码 1.2 展示了一个非常简单的文档注释
Nim 编译器包含了一个能给指定模块生成文档的命令。
实际代码在 代码 1.2 中,
比如说你电脑里有个 test.nim ,然后你可以执行 nim doc test.nim。
一般会在你的 test.nim 文件旁边生成一个 test.html。
在你最爱的那个浏览器中打开它,就能看到生成出来的 HTML
就像 图 1.1 中的截图这样:
test.nim 模块生成的文档注意截图和你看到的文本样式可能会有差异,请以实际效果为准:)。
"documentation comment"这俩字是斜体的,
因为在文档注释中是用星号(*)包裹起来的。
而 "test" 是用两个反引号包起来的,
这样能显得字体是等距的,
在讨论诸如变量名之类的标识符时很有用。
这些特殊的符号是文档生成器支持的 reStructuredText 标记语言的一小部分玩法。 文档生成器先解读你在命令行中指定的文件, 然后找到并逐一检查其中的所有文档注释。 每个文档注释都被 reStructuredText 解析器所解析。 然后文档生成器基于他解析的 reStructuredText 标记生成 HTML。
表 1.1列出了 reStructuredText 的一些语法。
| 语法 | 效果 | 用途 |
|---|---|---|
|
斜体 |
不明显地强调 |
|
粗体 |
明显强调 |
|
|
用于标识出 变量、过程 之类的名字. |
|
链接到其他网页 |
|
|
|
|
echo("Hello World")
|
|
用来展示示例代码。这将为指定的代码添加语法突出显示。 |
更全面的参考,请查看以下链接: http://sphinx-doc.org/rest.html
接下来我们再看个例子。
## 这是世界上最好的模块!
## 我们有一大堆文档!
##
##
## 示例
## ========
##
## 下面给你看几个例子:
##
##
## 把俩数加起来
## ---------------------------
##
## .. code-block:: nim
##
##   doAssert add(5, 5) == 10
##

proc add*(a, b: int): int =
  ## integer 类型的 ``a`` 加上 integer 类型的 ``b`` 然后返回运算结果。
return a + b-
代码 1.3 生成的文档 image::ch05_math_docs.png[]
从 代码 1.3 中的示例可以看出, 文档注释可以放在很多地方。
它们可以在全局作用域内,也可以在过程的局部作用域内。 在过程文档下的文档注释中,说明该过程的用途, Nim 文档生成器Nim文档生成器会生成模块中导出的所有过程的列表, 写了文档注释的的文档将会被显示在下面, 就像 图 1.2中那样。
这就是Nim标准库中使用注释和生成文档的方式。 有关如何使用注释和生成文档的更多实例,请查看 它的源码].
2. 分析代码
分析 应用,是指在应用运行时对其进行分析,以确定其所花费的时间。 像:它在哪个过程中花费时间最多啦、或者每个过程被调用了多少次之类的。 这些数值可以帮助你找到需要优化的代码区域。 有时它们还可以帮助您在应用程序中发现错误。
Nim 语言其实有很多很多能用的分析器。 挺惊人吧?毕竟 Nim 还是一门挺新的语言。 其实吧,这里的大多数分析器并不是专门给 Nim 创建的,而是给 C 。 C 分析器支持 Nim 应用,因为 Nim 可以编译为 C 。 要想用好这些分析器,你只需要了解这几件事。
事实上 Nim 编译器包含了一个探查器, 它是目前来说唯一一个用于对 Nim 应用程序进行性能分析的分析器。 在转到 C 分析器之前,让我们看一下它。
2.1. 使用 nimprof 进行性能分析
嵌入式堆栈跟踪分析器(ESTP)(有时也称为 NimProf)是标准 Nim 发行版中附带的 Nim 分析器。 要激活这个分析器,您只需执行以下步骤:
-
在你的程序的 Nim 主模块(将要编译的模块)中导入
nimprof模块, -
使用
--profiler:on和stacktrace:on标志编译程序。 -
正常运行它。
|
应用速度
分析你的应用程序时,运行速度会变慢,
这是因为分析器需要在运行时分析应用程序的执行情况,
这会带来明显的开销。
|
看一眼下面的代码。
import nimprof (1)
import strutils (2)

proc ab() =
  echo("Found letter")

proc num() =
  echo("Found number")

proc diff() =
  echo("Found something else")

proc analyse(x: string) =
  var i = 0
  while true:
    case x[i] (3)
    of Letters: ab()
    of {'0' .. '9'}: num()
    of '\0': break (4)
    else: diff()
    i.inc

for i in 0 .. 10000: (5)
analyse("uyguhijkmnbdv44354gasuygiuiolknchyqudsayd12635uha")| 1 | 有了 nimprof 模块,探查器才能正常工作,所以该模块至关重要。 |
| 2 | strutils 模块定义了 Letters 集合. |
| 3 | 字符串 x 中的每个字符都被遍历,如果这个字符是字母,那么调用 ab ;
如果是数字,就调用 num ;
其他情况调用 diff 。 |
| 4 | \0 表示到了字符串的结尾,我们在这停止循环。 |
| 5 | 为了使 Profiler 的结果更加可靠,我们进行了1万次分析。 |
将其另存为 main.nim ,
然后通过执行 nim c --profiler:on --stacktrace:on main.nim 来编译。
这个例子应该能成功编译。 然后,你可以运行它。
程序执行完毕后,您应该在终端窗口中看到一条类似于"writing profile_results.txt…"的消息。
main 程序会在你当前的工作目录中创建一个 profile_results.txt 文件,
文件的内容看起来应该和
代码 1.5差不多
total executions of each stack trace:
Entry: 1/4 Calls: 89/195 = 45.64% [sum: 89; 89/195 = 45.64%]
  analyse 192/195 = 98.46%
  main 195/195 = 100.00%
Entry: 2/4 Calls: 83/195 = 42.56% [sum: 172; 172/195 = 88.21%]
  ab 83/195 = 42.56%
  analyse 192/195 = 98.46%
  main 195/195 = 100.00%
Entry: 3/4 Calls: 20/195 = 10.26% [sum: 192; 192/195 = 98.46%]
  num 20/195 = 10.26%
  analyse 192/195 = 98.46%
  main 195/195 = 100.00%
Entry: 4/4 Calls: 3/195 = 1.54% [sum: 195; 195/195 = 100.00%]
  main 195/195 = 100.00%
在应用程序运行时,分析器会为当前正在执行的代码行拍摄多个快照。
它记录了应用程序最终如何执行那段代码堆栈跟踪。
然后记录在最常见的路径 profile_results.txt 中。
在 代码 1.5 所示的报告中,
分析器制作了195个快照。
它发现正在执行的过程 analyse 中的代码行在那些快照中占了45.64%。
42.56%的快照调用了 ab 过程,没毛病,因为传递给 analyse 的字符串主要由字母组成。
数字没那么多,所以 num 过程的执行仅占了这些快照的10.26%。
分析器没有监测到 diff 过程的调用,因为在字符串 x 中没有其他字符。
试着在传递给 analyse 过程的字符串中添加一些标点符号,
你会发现分析器监测到并显示出来了 diff 过程。
在不使用分析器的情况下,很容易确定 代码 1.4 中大部分程序处理了的位置。 但是对于更复杂的模块和应用,Nim Profiler 非常适合确定哪些程序最常用。
|
内存使用情况
Nim 分析器也可用于测量内存使用情况,
只需要使用`--profiler:off`、--stackTrace:on、和 -d:memProfiler 标志编译你的应用即可。
|
2.2. 使用 Valgrind 进行分析
不幸的是,分析器不都是跨平台的。 Valgrind 就是一个例子, 因为它并不支持 Windows 。
Valgrind 不只是一个分析器, 它是一个主要用来调试内存和检测内存泄漏的工具。 分析器组件叫做 Callgrind,它分析你的应用调用了哪些过程,以及这些过程之后的调用,依此类推。
叫做 KCacheGrind 的应用可以把 Callgrind 的结果可视化地输出出来。
|
安装 Valgrind
要使用此处的示例,您将需要将 Valgrind 工具与 KCacheGrind 一起安装。
如果您使用的是 Linux,很有可能操作系统上已经安装了这些工具。
在 Mac OS X 上,你可以简单地通过执行下面的代码来安装
brew install valgrind QCacheGrind.
|
让我们在 listing 1.4 中列出的应用中试一下 Valgrind 吧。
首先通过运行来重新编译没有任何标志的应用程序 nim c main。
你需要注释掉 main.nim 文件中的 import nimprof 这一行,才能成功完成此操作。
然后,执行以下命令,在 Valgrind 下运行刚才的应用: valgrind --tool=callgrind -v ./main
callgrind 工具比 Nim 分析器增加了更大的开销,
因此您可能需要终止应用程序,
可以通过同时按 Control 和 C 键来安全地终止应用程序。
callgrind工具提供的文本输出非常大, 因此想直接在文本编辑器中查看所有内容是不切实际的。
Thankfully a tool exists to allow us to explore it visually. This tool is called KCacheGrind (QCacheGrind on Mac OS X). You can execute it in the directory where you executed Valgrind to get something similar to the screenshot in figure 1.3.
The results of the Callgrind tool show many more calls during the lifetime of listing 1.4. This is because many of the C functions, which have been defined by Nim, during the translation to C are now visible. These functions are necessary to implement the behaviour of the code in listing 1.4.
The C function which is selected in the screenshots corresponds to the
analyse Nim procedure. Procedures' names undergo a process called name
mangling when translated to C functions, this prevents clashes between other
C functions. The name mangling process currently just adds an underscore
followed by a number to the C function name. Thankfully figuring out which
C functions correspond to which Nim procedures is still easy.
The output from Callgrind gives you more low-level details about the execution of your Nim applications. 图 1.3 shows the number of times every single C function has been executed, it allows you to diagnose performance problems which may be outside your control. But with greater power comes greater complexity so Valgrind has a higher learning curve than the Nim profiler.
3. Debugging Nim code
Debugging is one of the most important activities in software development. Bugs in software occur inadvertantly. When a user reports an issue with your software, how do you fix it?
The first step is to reproduce the issue. After that debugging tools help to diagnose the issue and to figure out its root cause.
Nim does many things to make debugging as easy as possible. For example it ensures that detailed and easy to understand stack traces are reported whenever your application crashes. Consider the following code in listing 1.6.
import strutils (1)
let line = stdin.readLine() (2)
let result = line.parseInt + 5 (3)
echo(line, " + 5 = ", result) (4)| 1 | The strutils module defines the parseInt procedure. |
| 2 | Read a line from the standard input. |
| 3 | The string line is converted into an integer, the number 5 is then
added to that integer. |
| 4 | Display the result of the calculation. |
This code is fairly simple. It reads a line of text from the standard input,
converts this line into an integer, adds the number 5 to it and displays
the result. Save this code as adder.nim and compile it by executing
nim c adder.nim, then execute the resulting binary. The program will
wait for your input, once you type in a number you will see the sum of 5
and the number you typed in. But what happens when you don’t type in a number?
Type in some text and observe the results. You should see something similar
to the output in listing 1.7 below.
ValueError exceptionTraceback (most recent call last)
adder.nim(3) adder (1)
strutils.nim parseInt (2)
Error: unhandled exception: invalid integer: some text [ValueError] (3)| 1 | The program was executing line 3 in the adder module… |
| 2 | … followed by the parseInt procedure which raised the ValueError
exception. |
| 3 | This is the exception message followed by the exception type in square brackets. |
The program crashed because an exception was raised and it was not caught
by any try statements. This resulted in a stack trace being displayed and
the program exiting. The stack trace in listing 1.7 is
very informative,
it leads directly to the line which caused the crash. After the adder.nim
module name, the number 3 points to the line number
in the adder module. This line is highlighted in
listing 1.8 below.
import strutils
let line = stdin.readLine()
let result = line.parseInt + 5
echo(line, " + 5 = ", result)
The parseInt procedure cannot convert strings containing only letters
into a number because no number exists in that string. The exception message
shown at the bottom of the stack trace informs us of this. It includes
the string value that parseInt attempted to parse which gives further hints
about what went wrong.
You may not think it but program crashes are a good thing when it comes to debugging. The truly horrible bugs are the ones which produce no crashes, but instead result in your program producing incorrect results. In such cases advanced debugging techniques need to be used. Debugging also comes in handy when a stack trace does not give enough information about the issue.
The primary purpose of debugging is to investigate the state of memory
at a particular point in the execution of your program. You may for example
want to find out what the value of the line variable is just before
the parseInt procedure is called. This can be done in many ways.
3.1. Debugging using echo
By far the simplest and most common approach is to use the echo
procedure. The echo
procedure allows you to display the value of most variables, as long as the
type of the variable implements the $ procedure it can be displayed.
For other variables the repr procedure can be used, you can pass any
type of variable to it and get a textual representation of that
variable’s value.
Using the repr procedure and echo, let’s investigate the value of the
line variable just before the call to parseInt.
line variable using repr.import strutils
let line = stdin.readLine()
echo("The value of the line variable is: ", repr(line))
let result = line.parseInt + 5
echo(line, " + 5 = ", result)The repr procedure is useful because it shows non-printable characters
in their escaped form. It also shows extra information about many types of
data. Running the example in listing 1.9 and typing in 3 Tab
characters results in the following output.
The value of the `line` variable is: 0x105ff3050"\9\9\9"
Traceback (most recent call last)
foo.nim(4)               foo
strutils.nim             parseInt
Error: unhandled exception: invalid integer:       [ValueError]
The exception message just shows some whitespace which is how Tab characters
are shown in normal text. But you have no way of distinguishing whether
that whitespace is just normal space characters or whether it is in fact a
multiple Tab characters. The repr procedure solves this ambiguity by showing
\9\9\9, the number 9 is the ASCII number code for the tab character.
The memory address of the line variable is also shown.
3.2. Using writeStackTrace
An unhandled exception is not the only way for a stack trace to be displayed. You may find it useful to display the current stack trace anywhere in your program for debugging purposes. This can give you vital information, especially in larger programs with many procedures, where it can show you the path through those procedures and how your program’s execution ended in a certain procedure.
Consider the following example.
writeStackTrace exampleproc a1() =
writeStackTrace()
proc a() =
a1()
a()Compiling and running this example will display the following stack trace.
Traceback (most recent call last)
foo.nim(7)               foo
foo.nim(5)               a
foo.nim(2)               a1
The a procedure is called first on line 7, followed by a1 at line 5,
and finally the writeStackTrace procedure is called on line 2.
3.3. Using GDB/LLDB
Sometimes a proper debugging tool is necessary for the truly complicated issues. As with profiling tools in the previous section, Nim programs can be debugged using most C debuggers. One of the most popular debugging tools is the GNU Debugger, its often known by the acronym GDB.
The GNU debugger should be included with your distribution of gcc which you should already have as part of your Nim installation. Unfortunately on the latest versions of Mac OS X installation of gdb is problematic, but you can use a similar debugger called LLDB. LLDB is a much newer debugger, but it functions in almost exactly the same way.
Let’s try to use GDB (or LLDB if you’re on Mac OS X) to debug the small
adder.nim example introduced in listing 1.8.
I will repeat the example below.
adder.nim exampleimport strutils
let line = stdin.readLine()
let result = line.parseInt + 5
echo(line, " + 5 = ", result)In order to use these debugging tools you will need to compile adder.nim
with two additional flags. The --debuginfo flag, which will instruct the
compiler to add extra debugging information to the resulting binary. The
debugging information will be used by GDB and LLDB to read procedure names
and line numbers of the currently executed code.
And also the --linedir:on flag which will include Nim-specific debug
information
such as module names and Nim source code lines. GDB and LLDB will use the
information added by the --linedir:on flag to report Nim-specific module
names and line numbers.
Putting both of these together you should compile the adder module using the
following command: nim c --debuginfo --linedir:on adder.nim.
|
The
Newer versions of Nim support the --debugger:native flag--debugger:native flag which is
equivalent to specifying the --linedir:on and --debuginfo flags.
|
The next step is to launch the debugging tool. The usage of both of these tools
is very similar. To launch the adder executable in GDB execute gdb adder
and to launch it in LLDB execute lldb adder. GDB or LLDB should launch
and you should see something similar to figure 1.4
or figure 1.5.
Once these tools are launched they will wait for input from the user.
The input is in the form of a command. Both of these tools support a range
of different commands for controlling the execution of the program, to watch
the values of specific variables, to set breakpoints and much more. To get a
full list of supported commands type in help and press enter.
The aim for this debugging session is to find out the value of the line
variable, just like in the
previous sections. To do this we need to set a breakpoint at line 3 in the
adder.nim file. Thankfully, both GDB and LLDB share the same command syntax
for creating
breakpoints. Simply type in b adder.nim:3 into the terminal and press enter.
A breakpoint should be successfully created, the debugger will confirm this
by displaying a message that is similar to 代码 5.23.
Breakpoint 1: where = adder`adderInit000 + 119 at adder.nim:3, address = 0x0000000100020f17Once the breakpoint is created, you can instruct the debugger to run the
adder program by using the run command. Type in run into the terminal
and press enter. The program won’t hit the breakpoint because it will first
read a line from standard input, so after you use the run command you will
need to type something else into the terminal. This time the adder program
will read it.
The debugger will then stop the execution of the program at line 3. Figures 1.6 and 1.7 show what that will look like.
At this point in the execution of the program, we should be able to display the
value of the line variable.
Displaying the value of a variable is the same in
both GDB and LLDB.
One can use the p (or print) command to display the value of any variable.
Unfortunately you cannot simply type in print line and get the result.
This is because of name mangling which I mentioned in the profiling section.
Before you can print out the value of the line variable you will need to
find out what the new name of it is. In almost all cases the variable name will
only have an underscore followed by a randomised number appended to it.
This makes finding the name rather trivial, but the process differs between
GDB and LLDB.
In GDB it is simple
to find out the name of the line variable, you can simply type in
print line_
and press the Tab button. GDB will then auto-complete the name for you, or give
you a list of choices.
As for LLDB, because it does not support auto-complete via the Tab key, this
is a bit more complicated. You need to find the name of the variable by looking
at the list of local and global variables in the current scope. You can get
a list of local variables by using the fr v -a
(or frame variable --no-args) command, and a list of global variables
by using the ta v (or target variable) command. The line variable is
a global variable so type in ta v to get a list of the global variables.
You should see something similar to the screenshot in figure 1.8.
You can see the line variable at the bottom of the list as line_106004.
Now print the line variable by using the print <var_name_here> command,
make sure to replace the <var_name_here> with the name of the line variable
that you found from the previous step. Figures 1.9 and
1.10 show what you may see.
line variable in GDB
line variable in LLDBThis unfortunately tells us nothing about the value of the line variable.
We are in the land of low-level C, so the line variable is a pointer to
a NimStringDesc type. We can dereference this pointer by appending an
asterisk to the beginning of the variable name: print *line_106004.
Doing this will show values of each of the fields in the NimStringDesc
type. Unfortunately in LLDB this does not show the value of the data field,
so we must explicitly access it: print (char*)line_106004->data. The
(char*) is required to cast the data field into something which LLDB
can display. Figures 1.11 and 1.12
show what this looks like in GDB and LLDB respectively.
line variable in GDB
line variable in LLDBThis is much more complicated than simply using the echo procedure, but should
be useful for more complicated debugging scenarios. Hopefully this gave you
an idea of how to compile your Nim program so that it can
be debugged using GDB and LLDB. There are many more features that
these debuggers provide which are beyond the scope of this article. These
features allow you to analyse the execution of your program in many other
ways. You may wish
to learn more by looking at the many resources available online for these
debuggers and many others.
4. Conclusion
Thank you for reading. If you require help with these topics or anything else related to Nim, be sure to get in touch with our community.
title: Nim代码的文档化、分析和调试指南 author: Dominik Picheta excerpt: 本指南讨论了一些用于注释和生成文档、分析和调试nim代码的实用工具。 ---
= Nim代码的文档化、分析和调试指南 :figure-caption: 图 1. :listing-caption: 代码 1. :table-caption: 表 1. :numbered: :toc: left
<img src="https://nim-cn.com/assets/img/nim_in_action_cover.jpg"/> </td> <td style="padding-left: 10pt;"> +++ 这一小篇手册最初是为了 https://book.picheta.me[Nim in Action]写的。
由于篇幅限制,书中并没有收录。 Nim in Action 的编写方式和这个指南很类似, 你可以把这本书买来(或找来)看看, 以便更加深入地了解 Nim 语言。
|
Discount
使用优惠码 fccpicheta 可以获得六四折优惠。
|
本手册将会和你一起探讨一些实用的工具, 用以文档化、分析和调试 Nim 代码。 我将会介绍如下内容:
-
在 Nim 的文档注释中使用的 reStructuredText 语言(RST)
-
Nim 性能和内存使用情况分析器
-
将 GDB/LLDB 与 Nim 一起使用
请务必准备好 nim 编译器, 并按照本指南中的说明进行操作, 以便达到最佳效果。
== 代码文档化
给代码写注释和文档非常重要! 尤其是在直接查看库的 api 甚至软件的源码时。 它能够解释软件中一些可能不是很明显细节,
有很多种方式来达到这个效果。 比如你可能已经知道了, Nim 像很多语言那样支持注释。 注释是源码的说明解释, 让代码能更容易地被理解。
在nim中,单行注释由井号 # 分隔。
多行注释由 #[ and ]# 包裹起来。
在代码 1.1 中,分别进行了这两者的示例。
var x = 5 # Assign 5 to x.
#[multi-
line (1)
comment]#| 1 | 这种语法还算是挺新的,所以一般都不会支持 Nim 的语法高亮。 |
Nim 也提供了一种叫做 "文档注释" 的特殊注释类型。
这种类型的注释由nim的文档生成器处理。
只要用两个井号 ## 写的注释都是文档注释。
## 这是``test`` 模块的 *文档注释* .代码 1.2 展示了一个非常简单的文档注释
Nim 编译器包含了一个能给指定模块生成文档的命令。
实际代码在 代码 1.2 中,
比如说你电脑里有个 test.nim ,然后你可以执行 nim doc test.nim。
一般会在你的 test.nim 文件旁边生成一个 test.html。
在你最爱的那个浏览器中打开它,就能看到生成出来的 HTML
就像 图 1.1 中的截图这样:
test.nim 模块生成的文档注意截图和你看到的文本样式可能会有差异,请以实际效果为准:)。
"documentation comment"这俩字是斜体的,
因为在文档注释中是用星号(*)包裹起来的。
而 "test" 是用两个反引号包起来的,
这样能显得字体是等距的,
在讨论诸如变量名之类的标识符时很有用。
这些特殊的符号是文档生成器支持的 reStructuredText 标记语言的一小部分玩法。 文档生成器先解读你在命令行中指定的文件, 然后找到并逐一检查其中的所有文档注释。 每个文档注释都被 reStructuredText 解析器所解析。 然后文档生成器基于他解析的 reStructuredText 标记生成 HTML。
表 1.1列出了 reStructuredText 的一些语法。
| 语法 | 效果 | 用途 |
|---|---|---|
|
斜体 |
不明显地强调 |
|
粗体 |
明显强调 |
|
|
用于标识出 变量、过程 之类的名字. |
|
链接到其他网页 |
|
|
|
|
echo("Hello World")
|
|
用来展示示例代码。这将为指定的代码添加语法突出显示。 |
更全面的参考,请查看以下链接: http://sphinx-doc.org/rest.html
接下来我们再看个例子。
## 这是世界上最好的模块!
## 我们有一大堆文档!
##
##
## 示例
## ========
##
## 下面给你看几个例子:
##
##
## 把俩数加起来
## ---------------------------
##
## .. code-block:: nim
##
## doAssert add(5, 5) == 10
##
proc add*(a, b: int): int =
## integer 类型的 ``a`` 加上 integer 类型的 ``b`` 然后返回运算结果。
return a + b-
代码 1.3 生成的文档 image::ch05_math_docs.png[]
从 代码 1.3 中的示例可以看出, 文档注释可以放在很多地方。
它们可以在全局作用域内,也可以在过程的局部作用域内。 在过程文档下的文档注释中,说明该过程的用途, Nim 文档生成器Nim文档生成器会生成模块中导出的所有过程的列表, 写了文档注释的的文档将会被显示在下面, 就像 图 1.2中那样。
这就是Nim标准库中使用注释和生成文档的方式。 有关如何使用注释和生成文档的更多实例,请查看 它的源码].
== 分析代码
分析 应用,是指在应用运行时对其进行分析,以确定其所花费的时间。 像:它在哪个过程中花费时间最多啦、或者每个过程被调用了多少次之类的。 这些数值可以帮助你找到需要优化的代码区域。 有时它们还可以帮助您在应用程序中发现错误。
Nim 语言其实有很多很多能用的分析器。 挺惊人吧?毕竟 Nim 还是一门挺新的语言。 其实吧,这里的大多数分析器并不是专门给 Nim 创建的,而是给 C 。 C 分析器支持 Nim 应用,因为 Nim 可以编译为 C 。 要想用好这些分析器,你只需要了解这几件事。
事实上 Nim 编译器包含了一个探查器, 它是目前来说唯一一个用于对 Nim 应用程序进行性能分析的分析器。 在转到 C 分析器之前,让我们看一下它。
=== 使用 nimprof 进行性能分析
嵌入式堆栈跟踪分析器(ESTP)(有时也称为 NimProf)是标准 Nim 发行版中附带的 Nim 分析器。 要激活这个分析器,您只需执行以下步骤:
-
在你的程序的 Nim 主模块(将要编译的模块)中导入
nimprof模块, -
使用
--profiler:on和stacktrace:on标志编译程序。 -
正常运行它。
|
应用速度
分析你的应用程序时,运行速度会变慢,
这是因为分析器需要在运行时分析应用程序的执行情况,
这会带来明显的开销。
|
看一眼下面的代码。
import nimprof (1)
import strutils (2)
proc ab() =
echo("Found letter")
proc num() =
echo("Found number")
proc diff() =
echo("Found something else")
proc analyse(x: string) =
var i = 0
while true:
case x[i] (3)
of Letters: ab()
of {'0' .. '9'}: num()
of '\0': break (4)
else: diff()
i.inc
for i in 0 .. 10000: (5)
analyse("uyguhijkmnbdv44354gasuygiuiolknchyqudsayd12635uha")| 1 | 有了 nimprof 模块,探查器才能正常工作,所以该模块至关重要。 |
| 2 | strutils 模块定义了 Letters 集合. |
| 3 | 字符串 x 中的每个字符都被遍历,如果这个字符是字母,那么调用 ab ;
如果是数字,就调用 num ;
其他情况调用 diff 。 |
| 4 | \0 表示到了字符串的结尾,我们在这停止循环。 |
| 5 | 为了使 Profiler 的结果更加可靠,我们进行了1万次分析。 |
将其另存为 main.nim ,
然后通过执行 nim c --profiler:on --stacktrace:on main.nim 来编译。
这个例子应该能成功编译。 然后,你可以运行它。
程序执行完毕后,您应该在终端窗口中看到一条类似于"writing profile_results.txt…"的消息。
main 程序会在你当前的工作目录中创建一个 profile_results.txt 文件,
文件的内容看起来应该和
代码 1.5差不多
total executions of each stack trace:
Entry: 1/4 Calls: 89/195 = 45.64% [sum: 89; 89/195 = 45.64%]
analyse 192/195 = 98.46%
main 195/195 = 100.00%
Entry: 2/4 Calls: 83/195 = 42.56% [sum: 172; 172/195 = 88.21%]
ab 83/195 = 42.56%
analyse 192/195 = 98.46%
main 195/195 = 100.00%
Entry: 3/4 Calls: 20/195 = 10.26% [sum: 192; 192/195 = 98.46%]
num 20/195 = 10.26%
analyse 192/195 = 98.46%
main 195/195 = 100.00%
Entry: 4/4 Calls: 3/195 = 1.54% [sum: 195; 195/195 = 100.00%]
main 195/195 = 100.00%在应用程序运行时,分析器会为当前正在执行的代码行拍摄多个快照。
它记录了应用程序最终如何执行那段代码堆栈跟踪。
然后记录在最常见的路径 profile_results.txt 中。
在 代码 1.5 所示的报告中,
分析器制作了195个快照。
它发现正在执行的过程 analyse 中的代码行在那些快照中占了45.64%。
42.56%的快照调用了 ab 过程,没毛病,因为传递给 analyse 的字符串主要由字母组成。
数字没那么多,所以 num 过程的执行仅占了这些快照的10.26%。
分析器没有监测到 diff 过程的调用,因为在字符串 x 中没有其他字符。
试着在传递给 analyse 过程的字符串中添加一些标点符号,
你会发现分析器监测到并显示出来了 diff 过程。
在不使用分析器的情况下,很容易确定 代码 1.4 中大部分程序处理了的位置。 但是对于更复杂的模块和应用,Nim Profiler 非常适合确定哪些程序最常用。
|
内存使用情况
Nim 分析器也可用于测量内存使用情况,
只需要使用`--profiler:off`、--stackTrace:on、和 -d:memProfiler 标志编译你的应用即可。
|
=== 使用 Valgrind 进行分析
不幸的是,分析器不都是跨平台的。 Valgrind 就是一个例子, 因为它并不支持 Windows 。
Valgrind 不只是一个分析器, 它是一个主要用来调试内存和检测内存泄漏的工具。 分析器组件叫做 Callgrind,它分析你的应用调用了哪些过程,以及这些过程之后的调用,依此类推。
叫做 KCacheGrind 的应用可以把 Callgrind 的结果可视化地输出出来。
|
安装 Valgrind
要使用此处的示例,您将需要将 Valgrind 工具与 KCacheGrind 一起安装。
如果您使用的是 Linux,很有可能操作系统上已经安装了这些工具。
在 Mac OS X 上,你可以简单地通过执行下面的代码来安装
brew install valgrind QCacheGrind.
|
让我们在 listing 1.4 中列出的应用中试一下 Valgrind 吧。
首先通过运行来重新编译没有任何标志的应用程序 nim c main。
你需要注释掉 main.nim 文件中的 import nimprof 这一行,才能成功完成此操作。
然后,执行以下命令,在 Valgrind 下运行刚才的应用: valgrind --tool=callgrind -v ./main
callgrind 工具比 Nim 分析器增加了更大的开销,
因此您可能需要终止应用程序,
可以通过同时按 Control 和 C 键来安全地终止应用程序。
callgrind工具提供的文本输出非常大, 因此想直接在文本编辑器中查看所有内容是不切实际的。
Thankfully a tool exists to allow us to explore it visually. This tool is called KCacheGrind (QCacheGrind on Mac OS X). You can execute it in the directory where you executed Valgrind to get something similar to the screenshot in figure 1.3.
The results of the Callgrind tool show many more calls during the lifetime of listing 1.4. This is because many of the C functions, which have been defined by Nim, during the translation to C are now visible. These functions are necessary to implement the behaviour of the code in listing 1.4.
The C function which is selected in the screenshots corresponds to the
analyse Nim procedure. Procedures' names undergo a process called name
mangling when translated to C functions, this prevents clashes between other
C functions. The name mangling process currently just adds an underscore
followed by a number to the C function name. Thankfully figuring out which
C functions correspond to which Nim procedures is still easy.
The output from Callgrind gives you more low-level details about the execution of your Nim applications. 图 1.3 shows the number of times every single C function has been executed, it allows you to diagnose performance problems which may be outside your control. But with greater power comes greater complexity so Valgrind has a higher learning curve than the Nim profiler.
== Debugging Nim code
Debugging is one of the most important activities in software development. Bugs in software occur inadvertantly. When a user reports an issue with your software, how do you fix it?
The first step is to reproduce the issue. After that debugging tools help to diagnose the issue and to figure out its root cause.
Nim does many things to make debugging as easy as possible. For example it ensures that detailed and easy to understand stack traces are reported whenever your application crashes. Consider the following code in listing 1.6.
import strutils (1)
let line = stdin.readLine() (2)
let result = line.parseInt + 5 (3)
echo(line, " + 5 = ", result) (4)| 1 | The strutils module defines the parseInt procedure. |
| 2 | Read a line from the standard input. |
| 3 | The string line is converted into an integer, the number 5 is then
added to that integer. |
| 4 | Display the result of the calculation. |
This code is fairly simple. It reads a line of text from the standard input,
converts this line into an integer, adds the number 5 to it and displays
the result. Save this code as adder.nim and compile it by executing
nim c adder.nim, then execute the resulting binary. The program will
wait for your input, once you type in a number you will see the sum of 5
and the number you typed in. But what happens when you don’t type in a number?
Type in some text and observe the results. You should see something similar
to the output in listing 1.7 below.
ValueError exceptionTraceback (most recent call last)
adder.nim(3) adder (1)
strutils.nim parseInt (2)
Error: unhandled exception: invalid integer: some text [ValueError] (3)| 1 | The program was executing line 3 in the adder module… |
| 2 | … followed by the parseInt procedure which raised the ValueError
exception. |
| 3 | This is the exception message followed by the exception type in square brackets. |
The program crashed because an exception was raised and it was not caught
by any try statements. This resulted in a stack trace being displayed and
the program exiting. The stack trace in listing 1.7 is
very informative,
it leads directly to the line which caused the crash. After the adder.nim
module name, the number 3 points to the line number
in the adder module. This line is highlighted in
listing 1.8 below.
import strutils
let line = stdin.readLine()
let result = line.parseInt + 5
echo(line, " + 5 = ", result)The parseInt procedure cannot convert strings containing only letters
into a number because no number exists in that string. The exception message
shown at the bottom of the stack trace informs us of this. It includes
the string value that parseInt attempted to parse which gives further hints
about what went wrong.
You may not think it but program crashes are a good thing when it comes to debugging. The truly horrible bugs are the ones which produce no crashes, but instead result in your program producing incorrect results. In such cases advanced debugging techniques need to be used. Debugging also comes in handy when a stack trace does not give enough information about the issue.
The primary purpose of debugging is to investigate the state of memory
at a particular point in the execution of your program. You may for example
want to find out what the value of the line variable is just before
the parseInt procedure is called. This can be done in many ways.
=== Debugging using echo
By far the simplest and most common approach is to use the echo
procedure. The echo
procedure allows you to display the value of most variables, as long as the
type of the variable implements the $ procedure it can be displayed.
For other variables the repr procedure can be used, you can pass any
type of variable to it and get a textual representation of that
variable’s value.
Using the repr procedure and echo, let’s investigate the value of the
line variable just before the call to parseInt.
line variable using repr.import strutils
let line = stdin.readLine()
echo("The value of the line variable is: ", repr(line))
let result = line.parseInt + 5
echo(line, " + 5 = ", result)The repr procedure is useful because it shows non-printable characters
in their escaped form. It also shows extra information about many types of
data. Running the example in listing 1.9 and typing in 3 Tab
characters results in the following output.
The value of the `line` variable is: 0x105ff3050"\9\9\9"
Traceback (most recent call last)
foo.nim(4) foo
strutils.nim parseInt
Error: unhandled exception: invalid integer: [ValueError]The exception message just shows some whitespace which is how Tab characters
are shown in normal text. But you have no way of distinguishing whether
that whitespace is just normal space characters or whether it is in fact a
multiple Tab characters. The repr procedure solves this ambiguity by showing
\9\9\9, the number 9 is the ASCII number code for the tab character.
The memory address of the line variable is also shown.
A procedure marked with the {.noSideEffect.} pragma is said to have no side
effect. This means that the procedure does not modify or read any
external state, such
as changing global variables or writing to a file. Marking a procedure as
having no side effects is useful when you want this to be enforced by the
compiler, that way the code will not compile unless the procedure
remains side effect free. For example consider the following add procedure,
it is said to contain no side effects because passing the same inputs to this
procedure will always produce the same output.
add procedureproc add(a, b: int): int {.noSideEffect.} =
return a + bThis creates a problem whenever you want to debug such procedures with the
echo procedure. The echo procedure is not side effect free because it
accesses a global stdout variable. So the following code will not compile.
echo cannot be used inside a side effect free procedureproc add(a, b: int): int {.noSideEffect.} =
echo("Value of a is:", a)
return a + bCompiling the code in listing 1.11 will fail with an error:
"'add' can have side effects". Thankfully the solution is simple. Nim provides
a side effect free echo for this very purpose, it is called debugEcho so
all you need to do is replace echo with debugEcho and the code will
compile.
=== Using writeStackTrace
An unhandled exception is not the only way for a stack trace to be displayed. You may find it useful to display the current stack trace anywhere in your program for debugging purposes. This can give you vital information, especially in larger programs with many procedures, where it can show you the path through those procedures and how your program’s execution ended in a certain procedure.
Consider the following example.
writeStackTrace exampleproc a1() =
writeStackTrace()
proc a() =
a1()
a()Compiling and running this example will display the following stack trace.
Traceback (most recent call last)
foo.nim(7) foo
foo.nim(5) a
foo.nim(2) a1The a procedure is called first on line 7, followed by a1 at line 5,
and finally the writeStackTrace procedure is called on line 2.
=== Using GDB/LLDB
Sometimes a proper debugging tool is necessary for the truly complicated issues. As with profiling tools in the previous section, Nim programs can be debugged using most C debuggers. One of the most popular debugging tools is the GNU Debugger, its often known by the acronym GDB.
The GNU debugger should be included with your distribution of gcc which you should already have as part of your Nim installation. Unfortunately on the latest versions of Mac OS X installation of gdb is problematic, but you can use a similar debugger called LLDB. LLDB is a much newer debugger, but it functions in almost exactly the same way.
Let’s try to use GDB (or LLDB if you’re on Mac OS X) to debug the small
adder.nim example introduced in listing 1.8.
I will repeat the example below.
adder.nim exampleimport strutils
let line = stdin.readLine()
let result = line.parseInt + 5
echo(line, " + 5 = ", result)In order to use these debugging tools you will need to compile adder.nim
with two additional flags. The --debuginfo flag, which will instruct the
compiler to add extra debugging information to the resulting binary. The
debugging information will be used by GDB and LLDB to read procedure names
and line numbers of the currently executed code.
And also the --linedir:on flag which will include Nim-specific debug
information
such as module names and Nim source code lines. GDB and LLDB will use the
information added by the --linedir:on flag to report Nim-specific module
names and line numbers.
Putting both of these together you should compile the adder module using the
following command: nim c --debuginfo --linedir:on adder.nim.
|
The
Newer versions of Nim support the --debugger:native flag--debugger:native flag which is
equivalent to specifying the --linedir:on and --debuginfo flags.
|
The next step is to launch the debugging tool. The usage of both of these tools
is very similar. To launch the adder executable in GDB execute gdb adder
and to launch it in LLDB execute lldb adder. GDB or LLDB should launch
and you should see something similar to figure 1.4
or figure 1.5.
Once these tools are launched they will wait for input from the user.
The input is in the form of a command. Both of these tools support a range
of different commands for controlling the execution of the program, to watch
the values of specific variables, to set breakpoints and much more. To get a
full list of supported commands type in help and press enter.
The aim for this debugging session is to find out the value of the line
variable, just like in the
previous sections. To do this we need to set a breakpoint at line 3 in the
adder.nim file. Thankfully, both GDB and LLDB share the same command syntax
for creating
breakpoints. Simply type in b adder.nim:3 into the terminal and press enter.
A breakpoint should be successfully created, the debugger will confirm this
by displaying a message that is similar to 代码 5.23.
Breakpoint 1: where = adder`adderInit000 + 119 at adder.nim:3, address = 0x0000000100020f17Once the breakpoint is created, you can instruct the debugger to run the
adder program by using the run command. Type in run into the terminal
and press enter. The program won’t hit the breakpoint because it will first
read a line from standard input, so after you use the run command you will
need to type something else into the terminal. This time the adder program
will read it.
The debugger will then stop the execution of the program at line 3. Figures 1.6 and 1.7 show what that will look like.
At this point in the execution of the program, we should be able to display the
value of the line variable.
Displaying the value of a variable is the same in
both GDB and LLDB.
One can use the p (or print) command to display the value of any variable.
Unfortunately you cannot simply type in print line and get the result.
This is because of name mangling which I mentioned in the profiling section.
Before you can print out the value of the line variable you will need to
find out what the new name of it is. In almost all cases the variable name will
only have an underscore followed by a randomised number appended to it.
This makes finding the name rather trivial, but the process differs between
GDB and LLDB.
In GDB it is simple
to find out the name of the line variable, you can simply type in
print line_
and press the Tab button. GDB will then auto-complete the name for you, or give
you a list of choices.
As for LLDB, because it does not support auto-complete via the Tab key, this
is a bit more complicated. You need to find the name of the variable by looking
at the list of local and global variables in the current scope. You can get
a list of local variables by using the fr v -a
(or frame variable --no-args) command, and a list of global variables
by using the ta v (or target variable) command. The line variable is
a global variable so type in ta v to get a list of the global variables.
You should see something similar to the screenshot in figure 1.8.
You can see the line variable at the bottom of the list as line_106004.
Now print the line variable by using the print <var_name_here> command,
make sure to replace the <var_name_here> with the name of the line variable
that you found from the previous step. Figures 1.9 and
1.10 show what you may see.
line variable in GDB
line variable in LLDBThis unfortunately tells us nothing about the value of the line variable.
We are in the land of low-level C, so the line variable is a pointer to
a NimStringDesc type. We can dereference this pointer by appending an
asterisk to the beginning of the variable name: print *line_106004.
Doing this will show values of each of the fields in the NimStringDesc
type. Unfortunately in LLDB this does not show the value of the data field,
so we must explicitly access it: print (char*)line_106004->data. The
(char*) is required to cast the data field into something which LLDB
can display. Figures 1.11 and 1.12
show what this looks like in GDB and LLDB respectively.
line variable in GDB
line variable in LLDBThis is much more complicated than simply using the echo procedure, but should
be useful for more complicated debugging scenarios. Hopefully this gave you
an idea of how to compile your Nim program so that it can
be debugged using GDB and LLDB. There are many more features that
these debuggers provide which are beyond the scope of this article. These
features allow you to analyse the execution of your program in many other
ways. You may wish
to learn more by looking at the many resources available online for these
debuggers and many others.
== Conclusion
Thank you for reading. If you require help with these topics or anything else related to Nim, be sure to get in touch with our community.
title: Nim代码的文档化、分析和调试指南 author: Dominik Picheta excerpt: 本指南讨论了一些用于注释和生成文档、分析和调试nim代码的实用工具。 ---
= Nim代码的文档化、分析和调试指南 :figure-caption: 图 1. :listing-caption: 代码 1. :table-caption: 表 1. :numbered: :toc: left

|
这一小篇手册最初是为了
Nim in Action写的。
由于篇幅限制,书中并没有收录。 Nim in Action 的编写方式和这个指南很类似, 你可以把这本书买来(或找来)看看, 以便更加深入地了解 Nim 语言。
|
本手册将会和你一起探讨一些实用的工具, 用以文档化、分析和调试 Nim 代码。 我将会介绍如下内容:
-
在 Nim 的文档注释中使用的 reStructuredText 语言(RST)
-
Nim 性能和内存使用情况分析器
-
将 GDB/LLDB 与 Nim 一起使用
请务必准备好 nim 编译器, 并按照本指南中的说明进行操作, 以便达到最佳效果。
== 代码文档化
给代码写注释和文档非常重要! 尤其是在直接查看库的 api 甚至软件的源码时。 它能够解释软件中一些可能不是很明显细节,
有很多种方式来达到这个效果。 比如你可能已经知道了, Nim 像很多语言那样支持注释。 注释是源码的说明解释, 让代码能更容易地被理解。
在nim中,单行注释由井号 # 分隔。
多行注释由 #[ and ]# 包裹起来。
在代码 1.1 中,分别进行了这两者的示例。
var x = 5 # Assign 5 to x.
#[multi-
  line      (1)
comment]#| 1 | 这种语法还算是挺新的,所以一般都不会支持 Nim 的语法高亮。 |
Nim 也提供了一种叫做 "文档注释" 的特殊注释类型。
这种类型的注释由nim的文档生成器处理。
只要用两个井号 ## 写的注释都是文档注释。
## 这是``test`` 模块的 *文档注释* .代码 1.2 展示了一个非常简单的文档注释
Nim 编译器包含了一个能给指定模块生成文档的命令。
实际代码在 代码 1.2 中,
比如说你电脑里有个 test.nim ,然后你可以执行 nim doc test.nim。
一般会在你的 test.nim 文件旁边生成一个 test.html。
在你最爱的那个浏览器中打开它,就能看到生成出来的 HTML
就像 图 1.1 中的截图这样:
test.nim 模块生成的文档注意截图和你看到的文本样式可能会有差异,请以实际效果为准:)。
"documentation comment"这俩字是斜体的,
因为在文档注释中是用星号(*)包裹起来的。
而 "test" 是用两个反引号包起来的,
这样能显得字体是等距的,
在讨论诸如变量名之类的标识符时很有用。
这些特殊的符号是文档生成器支持的 reStructuredText 标记语言的一小部分玩法。 文档生成器先解读你在命令行中指定的文件, 然后找到并逐一检查其中的所有文档注释。 每个文档注释都被 reStructuredText 解析器所解析。 然后文档生成器基于他解析的 reStructuredText 标记生成 HTML。
表 1.1列出了 reStructuredText 的一些语法。
| 语法 | 效果 | 用途 |
|---|---|---|
|
斜体 |
不明显地强调 |
|
粗体 |
明显强调 |
|
|
用于标识出 变量、过程 之类的名字. |
|
链接到其他网页 |
|
|
|
|
echo("Hello World")
|
|
用来展示示例代码。这将为指定的代码添加语法突出显示。 |
更全面的参考,请查看以下链接: http://sphinx-doc.org/rest.html
接下来我们再看个例子。
## 这是世界上最好的模块!
## 我们有一大堆文档!
##
##
## 示例
## ========
##
## 下面给你看几个例子:
##
##
## 把俩数加起来
## ---------------------------
##
## .. code-block:: nim
##
##   doAssert add(5, 5) == 10
##

proc add*(a, b: int): int =
  ## integer 类型的 ``a`` 加上 integer 类型的 ``b`` 然后返回运算结果。
return a + b-
代码 1.3 生成的文档 image::ch05_math_docs.png[]
从 代码 1.3 中的示例可以看出, 文档注释可以放在很多地方。
它们可以在全局作用域内,也可以在过程的局部作用域内。 在过程文档下的文档注释中,说明该过程的用途, Nim 文档生成器Nim文档生成器会生成模块中导出的所有过程的列表, 写了文档注释的的文档将会被显示在下面, 就像 图 1.2中那样。
这就是Nim标准库中使用注释和生成文档的方式。 有关如何使用注释和生成文档的更多实例,请查看 它的源码].
== 分析代码
分析 应用,是指在应用运行时对其进行分析,以确定其所花费的时间。 像:它在哪个过程中花费时间最多啦、或者每个过程被调用了多少次之类的。 这些数值可以帮助你找到需要优化的代码区域。 有时它们还可以帮助您在应用程序中发现错误。
Nim 语言其实有很多很多能用的分析器。 挺惊人吧?毕竟 Nim 还是一门挺新的语言。 其实吧,这里的大多数分析器并不是专门给 Nim 创建的,而是给 C 。 C 分析器支持 Nim 应用,因为 Nim 可以编译为 C 。 要想用好这些分析器,你只需要了解这几件事。
事实上 Nim 编译器包含了一个探查器, 它是目前来说唯一一个用于对 Nim 应用程序进行性能分析的分析器。 在转到 C 分析器之前,让我们看一下它。
=== 使用 nimprof 进行性能分析
嵌入式堆栈跟踪分析器(ESTP)(有时也称为 NimProf)是标准 Nim 发行版中附带的 Nim 分析器。 要激活这个分析器,您只需执行以下步骤:
-
在你的程序的 Nim 主模块(将要编译的模块)中导入
nimprof模块, -
使用
--profiler:on和stacktrace:on标志编译程序。 -
正常运行它。
|
应用速度
分析你的应用程序时,运行速度会变慢,
这是因为分析器需要在运行时分析应用程序的执行情况,
这会带来明显的开销。
|
看一眼下面的代码。
import nimprof (1)
import strutils (2)

proc ab() =
  echo("Found letter")

proc num() =
  echo("Found number")

proc diff() =
  echo("Found something else")

proc analyse(x: string) =
  var i = 0
  while true:
    case x[i] (3)
    of Letters: ab()
    of {'0' .. '9'}: num()
    of '\0': break (4)
    else: diff()
    i.inc

for i in 0 .. 10000: (5)
analyse("uyguhijkmnbdv44354gasuygiuiolknchyqudsayd12635uha")| 1 | 有了 nimprof 模块,探查器才能正常工作,所以该模块至关重要。 |
| 2 | strutils 模块定义了 Letters 集合. |
| 3 | 字符串 x 中的每个字符都被遍历,如果这个字符是字母,那么调用 ab ;
如果是数字,就调用 num ;
其他情况调用 diff 。 |
| 4 | \0 表示到了字符串的结尾,我们在这停止循环。 |
| 5 | 为了使 Profiler 的结果更加可靠,我们进行了1万次分析。 |
将其另存为 main.nim ,
然后通过执行 nim c --profiler:on --stacktrace:on main.nim 来编译。
这个例子应该能成功编译。 然后,你可以运行它。
程序执行完毕后,您应该在终端窗口中看到一条类似于"writing profile_results.txt…"的消息。
main 程序会在你当前的工作目录中创建一个 profile_results.txt 文件,
文件的内容看起来应该和
代码 1.5差不多
total executions of each stack trace:
Entry: 1/4 Calls: 89/195 = 45.64% [sum: 89; 89/195 = 45.64%]
  analyse 192/195 = 98.46%
  main 195/195 = 100.00%
Entry: 2/4 Calls: 83/195 = 42.56% [sum: 172; 172/195 = 88.21%]
  ab 83/195 = 42.56%
  analyse 192/195 = 98.46%
  main 195/195 = 100.00%
Entry: 3/4 Calls: 20/195 = 10.26% [sum: 192; 192/195 = 98.46%]
  num 20/195 = 10.26%
  analyse 192/195 = 98.46%
  main 195/195 = 100.00%
Entry: 4/4 Calls: 3/195 = 1.54% [sum: 195; 195/195 = 100.00%]
  main 195/195 = 100.00%
在应用程序运行时,分析器会为当前正在执行的代码行拍摄多个快照。
它记录了应用程序最终如何执行那段代码堆栈跟踪。
然后记录在最常见的路径 profile_results.txt 中。
在 代码 1.5 所示的报告中,
分析器制作了195个快照。
它发现正在执行的过程 analyse 中的代码行在那些快照中占了45.64%。
42.56%的快照调用了 ab 过程,没毛病,因为传递给 analyse 的字符串主要由字母组成。
数字没那么多,所以 num 过程的执行仅占了这些快照的10.26%。
分析器没有监测到 diff 过程的调用,因为在字符串 x 中没有其他字符。
试着在传递给 analyse 过程的字符串中添加一些标点符号,
你会发现分析器监测到并显示出来了 diff 过程。
在不使用分析器的情况下,很容易确定 代码 1.4 中大部分程序处理了的位置。 但是对于更复杂的模块和应用,Nim Profiler 非常适合确定哪些程序最常用。
|
内存使用情况
Nim 分析器也可用于测量内存使用情况,
只需要使用`--profiler:off`、--stackTrace:on、和 -d:memProfiler 标志编译你的应用即可。
|
=== 使用 Valgrind 进行分析
不幸的是,分析器不都是跨平台的。 Valgrind 就是一个例子, 因为它并不支持 Windows 。
Valgrind 不只是一个分析器, 它是一个主要用来调试内存和检测内存泄漏的工具。 分析器组件叫做 Callgrind,它分析你的应用调用了哪些过程,以及这些过程之后的调用,依此类推。
叫做 KCacheGrind 的应用可以把 Callgrind 的结果可视化地输出出来。
|
安装 Valgrind
要使用此处的示例,您将需要将 Valgrind 工具与 KCacheGrind 一起安装。
如果您使用的是 Linux,很有可能操作系统上已经安装了这些工具。
在 Mac OS X 上,你可以简单地通过执行下面的代码来安装
brew install valgrind QCacheGrind.
|
让我们在 listing 1.4 中列出的应用中试一下 Valgrind 吧。
首先通过运行来重新编译没有任何标志的应用程序 nim c main。
你需要注释掉 main.nim 文件中的 import nimprof 这一行,才能成功完成此操作。
然后,执行以下命令,在 Valgrind 下运行刚才的应用: valgrind --tool=callgrind -v ./main
callgrind 工具比 Nim 分析器增加了更大的开销,
因此您可能需要终止应用程序,
可以通过同时按 Control 和 C 键来安全地终止应用程序。
callgrind工具提供的文本输出非常大, 因此想直接在文本编辑器中查看所有内容是不切实际的。
Thankfully a tool exists to allow us to explore it visually. This tool is called KCacheGrind (QCacheGrind on Mac OS X). You can execute it in the directory where you executed Valgrind to get something similar to the screenshot in figure 1.3.
The results of the Callgrind tool show many more calls during the lifetime of listing 1.4. This is because many of the C functions, which have been defined by Nim, during the translation to C are now visible. These functions are necessary to implement the behaviour of the code in listing 1.4.
The C function which is selected in the screenshots corresponds to the
analyse Nim procedure. Procedures' names undergo a process called name
mangling when translated to C functions, this prevents clashes between other
C functions. The name mangling process currently just adds an underscore
followed by a number to the C function name. Thankfully figuring out which
C functions correspond to which Nim procedures is still easy.
The output from Callgrind gives you more low-level details about the execution of your Nim applications. 图 1.3 shows the number of times every single C function has been executed, it allows you to diagnose performance problems which may be outside your control. But with greater power comes greater complexity so Valgrind has a higher learning curve than the Nim profiler.
== Debugging Nim code
Debugging is one of the most important activities in software development. Bugs in software occur inadvertantly. When a user reports an issue with your software, how do you fix it?
The first step is to reproduce the issue. After that debugging tools help to diagnose the issue and to figure out its root cause.
Nim does many things to make debugging as easy as possible. For example it ensures that detailed and easy to understand stack traces are reported whenever your application crashes. Consider the following code in listing 1.6.
import strutils (1)
let line = stdin.readLine() (2)
let result = line.parseInt + 5 (3)
echo(line, " + 5 = ", result) (4)| 1 | The strutils module defines the parseInt procedure. |
| 2 | Read a line from the standard input. |
| 3 | The string line is converted into an integer, the number 5 is then
added to that integer. |
| 4 | Display the result of the calculation. |
This code is fairly simple. It reads a line of text from the standard input,
converts this line into an integer, adds the number 5 to it and displays
the result. Save this code as adder.nim and compile it by executing
nim c adder.nim, then execute the resulting binary. The program will
wait for your input, once you type in a number you will see the sum of 5
and the number you typed in. But what happens when you don’t type in a number?
Type in some text and observe the results. You should see something similar
to the output in listing 1.7 below.
ValueError exceptionTraceback (most recent call last)
adder.nim(3) adder (1)
strutils.nim parseInt (2)
Error: unhandled exception: invalid integer: some text [ValueError] (3)| 1 | The program was executing line 3 in the adder module… |
| 2 | … followed by the parseInt procedure which raised the ValueError
exception. |
| 3 | This is the exception message followed by the exception type in square brackets. |
The program crashed because an exception was raised and it was not caught
by any try statements. This resulted in a stack trace being displayed and
the program exiting. The stack trace in listing 1.7 is
very informative,
it leads directly to the line which caused the crash. After the adder.nim
module name, the number 3 points to the line number
in the adder module. This line is highlighted in
listing 1.8 below.
import strutils
let line = stdin.readLine()
let result = line.parseInt + 5
echo(line, " + 5 = ", result)
The parseInt procedure cannot convert strings containing only letters
into a number because no number exists in that string. The exception message
shown at the bottom of the stack trace informs us of this. It includes
the string value that parseInt attempted to parse which gives further hints
about what went wrong.
You may not think it but program crashes are a good thing when it comes to debugging. The truly horrible bugs are the ones which produce no crashes, but instead result in your program producing incorrect results. In such cases advanced debugging techniques need to be used. Debugging also comes in handy when a stack trace does not give enough information about the issue.
The primary purpose of debugging is to investigate the state of memory
at a particular point in the execution of your program. You may for example
want to find out what the value of the line variable is just before
the parseInt procedure is called. This can be done in many ways.
=== Debugging using echo
By far the simplest and most common approach is to use the echo
procedure. The echo
procedure allows you to display the value of most variables, as long as the
type of the variable implements the $ procedure it can be displayed.
For other variables the repr procedure can be used, you can pass any
type of variable to it and get a textual representation of that
variable’s value.
Using the repr procedure and echo, let’s investigate the value of the
line variable just before the call to parseInt.
line variable using repr.import strutils
let line = stdin.readLine()
echo("The value of the line variable is: ", repr(line))
let result = line.parseInt + 5
echo(line, " + 5 = ", result)The repr procedure is useful because it shows non-printable characters
in their escaped form. It also shows extra information about many types of
data. Running the example in listing 1.9 and typing in 3 Tab
characters results in the following output.
The value of the `line` variable is: 0x105ff3050"\9\9\9"
Traceback (most recent call last)
foo.nim(4)               foo
strutils.nim             parseInt
Error: unhandled exception: invalid integer:       [ValueError]
The exception message just shows some whitespace which is how Tab characters
are shown in normal text. But you have no way of distinguishing whether
that whitespace is just normal space characters or whether it is in fact a
multiple Tab characters. The repr procedure solves this ambiguity by showing
\9\9\9, the number 9 is the ASCII number code for the tab character.
The memory address of the line variable is also shown.
A procedure marked with the {.noSideEffect.} pragma is said to have no side
effect. This means that the procedure does not modify or read any
external state, such
as changing global variables or writing to a file. Marking a procedure as
having no side effects is useful when you want this to be enforced by the
compiler, that way the code will not compile unless the procedure
remains side effect free. For example consider the following add procedure,
it is said to contain no side effects because passing the same inputs to this
procedure will always produce the same output.
add procedureproc add(a, b: int): int {.noSideEffect.} =
return a + bThis creates a problem whenever you want to debug such procedures with the
echo procedure. The echo procedure is not side effect free because it
accesses a global stdout variable. So the following code will not compile.
echo cannot be used inside a side effect free procedureproc add(a, b: int): int {.noSideEffect.} =
echo("Value of a is:", a)
return a + bCompiling the code in listing 1.11 will fail with an error:
"'add' can have side effects". Thankfully the solution is simple. Nim provides
a side effect free echo for this very purpose, it is called debugEcho so
all you need to do is replace echo with debugEcho and the code will
compile.
=== Using writeStackTrace
An unhandled exception is not the only way for a stack trace to be displayed. You may find it useful to display the current stack trace anywhere in your program for debugging purposes. This can give you vital information, especially in larger programs with many procedures, where it can show you the path through those procedures and how your program’s execution ended in a certain procedure.
Consider the following example.
writeStackTrace exampleproc a1() =
writeStackTrace()
proc a() =
a1()
a()Compiling and running this example will display the following stack trace.
Traceback (most recent call last)
foo.nim(7)               foo
foo.nim(5)               a
foo.nim(2)               a1
The a procedure is called first on line 7, followed by a1 at line 5,
and finally the writeStackTrace procedure is called on line 2.
=== Using GDB/LLDB
Sometimes a proper debugging tool is necessary for the truly complicated issues. As with profiling tools in the previous section, Nim programs can be debugged using most C debuggers. One of the most popular debugging tools is the GNU Debugger, its often known by the acronym GDB.
The GNU debugger should be included with your distribution of gcc which you should already have as part of your Nim installation. Unfortunately on the latest versions of Mac OS X installation of gdb is problematic, but you can use a similar debugger called LLDB. LLDB is a much newer debugger, but it functions in almost exactly the same way.
Let’s try to use GDB (or LLDB if you’re on Mac OS X) to debug the small
adder.nim example introduced in listing 1.8.
I will repeat the example below.
adder.nim exampleimport strutils
let line = stdin.readLine()
let result = line.parseInt + 5
echo(line, " + 5 = ", result)In order to use these debugging tools you will need to compile adder.nim
with two additional flags. The --debuginfo flag, which will instruct the
compiler to add extra debugging information to the resulting binary. The
debugging information will be used by GDB and LLDB to read procedure names
and line numbers of the currently executed code.
And also the --linedir:on flag which will include Nim-specific debug
information
such as module names and Nim source code lines. GDB and LLDB will use the
information added by the --linedir:on flag to report Nim-specific module
names and line numbers.
Putting both of these together you should compile the adder module using the
following command: nim c --debuginfo --linedir:on adder.nim.
|
The
Newer versions of Nim support the --debugger:native flag--debugger:native flag which is
equivalent to specifying the --linedir:on and --debuginfo flags.
|
The next step is to launch the debugging tool. The usage of both of these tools
is very similar. To launch the adder executable in GDB execute gdb adder
and to launch it in LLDB execute lldb adder. GDB or LLDB should launch
and you should see something similar to figure 1.4
or figure 1.5.
Once these tools are launched they will wait for input from the user.
The input is in the form of a command. Both of these tools support a range
of different commands for controlling the execution of the program, to watch
the values of specific variables, to set breakpoints and much more. To get a
full list of supported commands type in help and press enter.
The aim for this debugging session is to find out the value of the line
variable, just like in the
previous sections. To do this we need to set a breakpoint at line 3 in the
adder.nim file. Thankfully, both GDB and LLDB share the same command syntax
for creating
breakpoints. Simply type in b adder.nim:3 into the terminal and press enter.
A breakpoint should be successfully created, the debugger will confirm this
by displaying a message that is similar to 代码 5.23.
Breakpoint 1: where = adder`adderInit000 + 119 at adder.nim:3, address = 0x0000000100020f17Once the breakpoint is created, you can instruct the debugger to run the
adder program by using the run command. Type in run into the terminal
and press enter. The program won’t hit the breakpoint because it will first
read a line from standard input, so after you use the run command you will
need to type something else into the terminal. This time the adder program
will read it.
The debugger will then stop the execution of the program at line 3. Figures 1.6 and 1.7 show what that will look like.
At this point in the execution of the program, we should be able to display the
value of the line variable.
Displaying the value of a variable is the same in
both GDB and LLDB.
One can use the p (or print) command to display the value of any variable.
Unfortunately you cannot simply type in print line and get the result.
This is because of name mangling which I mentioned in the profiling section.
Before you can print out the value of the line variable you will need to
find out what the new name of it is. In almost all cases the variable name will
only have an underscore followed by a randomised number appended to it.
This makes finding the name rather trivial, but the process differs between
GDB and LLDB.
In GDB it is simple
to find out the name of the line variable, you can simply type in
print line_
and press the Tab button. GDB will then auto-complete the name for you, or give
you a list of choices.
As for LLDB, because it does not support auto-complete via the Tab key, this
is a bit more complicated. You need to find the name of the variable by looking
at the list of local and global variables in the current scope. You can get
a list of local variables by using the fr v -a
(or frame variable --no-args) command, and a list of global variables
by using the ta v (or target variable) command. The line variable is
a global variable so type in ta v to get a list of the global variables.
You should see something similar to the screenshot in figure 1.8.
You can see the line variable at the bottom of the list as line_106004.
Now print the line variable by using the print <var_name_here> command,
make sure to replace the <var_name_here> with the name of the line variable
that you found from the previous step. Figures 1.9 and
1.10 show what you may see.
line variable in GDB
line variable in LLDBThis unfortunately tells us nothing about the value of the line variable.
We are in the land of low-level C, so the line variable is a pointer to
a NimStringDesc type. We can dereference this pointer by appending an
asterisk to the beginning of the variable name: print *line_106004.
Doing this will show values of each of the fields in the NimStringDesc
type. Unfortunately in LLDB this does not show the value of the data field,
so we must explicitly access it: print (char*)line_106004->data. The
(char*) is required to cast the data field into something which LLDB
can display. Figures 1.11 and 1.12
show what this looks like in GDB and LLDB respectively.
line variable in GDB
line variable in LLDBThis is much more complicated than simply using the echo procedure, but should
be useful for more complicated debugging scenarios. Hopefully this gave you
an idea of how to compile your Nim program so that it can
be debugged using GDB and LLDB. There are many more features that
these debuggers provide which are beyond the scope of this article. These
features allow you to analyse the execution of your program in many other
ways. You may wish
to learn more by looking at the many resources available online for these
debuggers and many others.
== Conclusion
Thank you for reading. If you require help with these topics or anything else related to Nim, be sure to get in touch with our community.
title: Nim代码的文档化、分析和调试指南 author: Dominik Picheta excerpt: 本指南讨论了一些用于注释和生成文档、分析和调试nim代码的实用工具。 ---
= Nim代码的文档化、分析和调试指南 :figure-caption: 图 1. :listing-caption: 代码 1. :table-caption: 表 1. :numbered: :toc: left
|
|
这一小篇手册最初是为了
Nim in Action写的。
由于篇幅限制,书中并没有收录。 Nim in Action 的编写方式和这个指南很类似, 你可以把这本书买来(或找来)看看, 以便更加深入地了解 Nim 语言。
|
本手册将会和你一起探讨一些实用的工具, 用以文档化、分析和调试 Nim 代码。 我将会介绍如下内容:
-
在 Nim 的文档注释中使用的 reStructuredText 语言(RST)
-
Nim 性能和内存使用情况分析器
-
将 GDB/LLDB 与 Nim 一起使用
请务必准备好 nim 编译器, 并按照本指南中的说明进行操作, 以便达到最佳效果。
== 代码文档化
给代码写注释和文档非常重要! 尤其是在直接查看库的 api 甚至软件的源码时。 它能够解释软件中一些可能不是很明显细节,
有很多种方式来达到这个效果。 比如你可能已经知道了, Nim 像很多语言那样支持注释。 注释是源码的说明解释, 让代码能更容易地被理解。
在nim中,单行注释由井号 # 分隔。
多行注释由 #[ and ]# 包裹起来。
在代码 1.1 中,分别进行了这两者的示例。
var x = 5 # Assign 5 to x.
#[multi-
line (1)
comment]#| 1 | 这种语法还算是挺新的,所以一般都不会支持 Nim 的语法高亮。 |
Nim 也提供了一种叫做 "文档注释" 的特殊注释类型。
这种类型的注释由nim的文档生成器处理。
只要用两个井号 ## 写的注释都是文档注释。
## 这是``test`` 模块的 *文档注释* .代码 1.2 展示了一个非常简单的文档注释
Nim 编译器包含了一个能给指定模块生成文档的命令。
实际代码在 代码 1.2 中,
比如说你电脑里有个 test.nim ,然后你可以执行 nim doc test.nim。
一般会在你的 test.nim 文件旁边生成一个 test.html。
在你最爱的那个浏览器中打开它,就能看到生成出来的 HTML
就像 图 1.1 中的截图这样:
test.nim 模块生成的文档注意截图和你看到的文本样式可能会有差异,请以实际效果为准:)。
"documentation comment"这俩字是斜体的,
因为在文档注释中是用星号(*)包裹起来的。
而 "test" 是用两个反引号包起来的,
这样能显得字体是等距的,
在讨论诸如变量名之类的标识符时很有用。
这些特殊的符号是文档生成器支持的 reStructuredText 标记语言的一小部分玩法。 文档生成器先解读你在命令行中指定的文件, 然后找到并逐一检查其中的所有文档注释。 每个文档注释都被 reStructuredText 解析器所解析。 然后文档生成器基于他解析的 reStructuredText 标记生成 HTML。
表 1.1列出了 reStructuredText 的一些语法。
| 语法 | 效果 | 用途 |
|---|---|---|
|
斜体 |
不明显地强调 |
|
粗体 |
明显强调 |
|
|
用于标识出 变量、过程 之类的名字. |
|
链接到其他网页 |
|
|
|
|
echo("Hello World")
|
|
用来展示示例代码。这将为指定的代码添加语法突出显示。 |
更全面的参考,请查看以下链接: http://sphinx-doc.org/rest.html
接下来我们再看个例子。
## 这是世界上最好的模块!
## 我们有一大堆文档!
##
##
## 示例
## ========
##
## 下面给你看几个例子:
##
##
## 把俩数加起来
## ---------------------------
##
## .. code-block:: nim
##
## doAssert add(5, 5) == 10
##
proc add*(a, b: int): int =
## integer 类型的 ``a`` 加上 integer 类型的 ``b`` 然后返回运算结果。
return a + b-
代码 1.3 生成的文档 image::ch05_math_docs.png[]
从 代码 1.3 中的示例可以看出, 文档注释可以放在很多地方。
它们可以在全局作用域内,也可以在过程的局部作用域内。 在过程文档下的文档注释中,说明该过程的用途, Nim 文档生成器Nim文档生成器会生成模块中导出的所有过程的列表, 写了文档注释的的文档将会被显示在下面, 就像 图 1.2中那样。
这就是Nim标准库中使用注释和生成文档的方式。 有关如何使用注释和生成文档的更多实例,请查看 它的源码].
== 分析代码
分析 应用,是指在应用运行时对其进行分析,以确定其所花费的时间。 像:它在哪个过程中花费时间最多啦、或者每个过程被调用了多少次之类的。 这些数值可以帮助你找到需要优化的代码区域。 有时它们还可以帮助您在应用程序中发现错误。
Nim 语言其实有很多很多能用的分析器。 挺惊人吧?毕竟 Nim 还是一门挺新的语言。 其实吧,这里的大多数分析器并不是专门给 Nim 创建的,而是给 C 。 C 分析器支持 Nim 应用,因为 Nim 可以编译为 C 。 要想用好这些分析器,你只需要了解这几件事。
事实上 Nim 编译器包含了一个探查器, 它是目前来说唯一一个用于对 Nim 应用程序进行性能分析的分析器。 在转到 C 分析器之前,让我们看一下它。
=== 使用 nimprof 进行性能分析
嵌入式堆栈跟踪分析器(ESTP)(有时也称为 NimProf)是标准 Nim 发行版中附带的 Nim 分析器。 要激活这个分析器,您只需执行以下步骤:
-
在你的程序的 Nim 主模块(将要编译的模块)中导入
nimprof模块, -
使用
--profiler:on和stacktrace:on标志编译程序。 -
正常运行它。
|
应用速度
分析你的应用程序时,运行速度会变慢,
这是因为分析器需要在运行时分析应用程序的执行情况,
这会带来明显的开销。
|
看一眼下面的代码。
import nimprof (1)
import strutils (2)
proc ab() =
echo("Found letter")
proc num() =
echo("Found number")
proc diff() =
echo("Found something else")
proc analyse(x: string) =
var i = 0
while true:
case x[i] (3)
of Letters: ab()
of {'0' .. '9'}: num()
of '\0': break (4)
else: diff()
i.inc
for i in 0 .. 10000: (5)
analyse("uyguhijkmnbdv44354gasuygiuiolknchyqudsayd12635uha")| 1 | 有了 nimprof 模块,探查器才能正常工作,所以该模块至关重要。 |
| 2 | strutils 模块定义了 Letters 集合. |
| 3 | 字符串 x 中的每个字符都被遍历,如果这个字符是字母,那么调用 ab ;
如果是数字,就调用 num ;
其他情况调用 diff 。 |
| 4 | \0 表示到了字符串的结尾,我们在这停止循环。 |
| 5 | 为了使 Profiler 的结果更加可靠,我们进行了1万次分析。 |
将其另存为 main.nim ,
然后通过执行 nim c --profiler:on --stacktrace:on main.nim 来编译。
这个例子应该能成功编译。 然后,你可以运行它。
程序执行完毕后,您应该在终端窗口中看到一条类似于"writing profile_results.txt…"的消息。
main 程序会在你当前的工作目录中创建一个 profile_results.txt 文件,
文件的内容看起来应该和
代码 1.5差不多
total executions of each stack trace:
Entry: 1/4 Calls: 89/195 = 45.64% [sum: 89; 89/195 = 45.64%]
analyse 192/195 = 98.46%
main 195/195 = 100.00%
Entry: 2/4 Calls: 83/195 = 42.56% [sum: 172; 172/195 = 88.21%]
ab 83/195 = 42.56%
analyse 192/195 = 98.46%
main 195/195 = 100.00%
Entry: 3/4 Calls: 20/195 = 10.26% [sum: 192; 192/195 = 98.46%]
num 20/195 = 10.26%
analyse 192/195 = 98.46%
main 195/195 = 100.00%
Entry: 4/4 Calls: 3/195 = 1.54% [sum: 195; 195/195 = 100.00%]
main 195/195 = 100.00%在应用程序运行时,分析器会为当前正在执行的代码行拍摄多个快照。
它记录了应用程序最终如何执行那段代码堆栈跟踪。
然后记录在最常见的路径 profile_results.txt 中。
在 代码 1.5 所示的报告中,
分析器制作了195个快照。
它发现正在执行的过程 analyse 中的代码行在那些快照中占了45.64%。
42.56%的快照调用了 ab 过程,没毛病,因为传递给 analyse 的字符串主要由字母组成。
数字没那么多,所以 num 过程的执行仅占了这些快照的10.26%。
分析器没有监测到 diff 过程的调用,因为在字符串 x 中没有其他字符。
试着在传递给 analyse 过程的字符串中添加一些标点符号,
你会发现分析器监测到并显示出来了 diff 过程。
在不使用分析器的情况下,很容易确定 代码 1.4 中大部分程序处理了的位置。 但是对于更复杂的模块和应用,Nim Profiler 非常适合确定哪些程序最常用。
|
内存使用情况
Nim 分析器也可用于测量内存使用情况,
只需要使用`--profiler:off`、--stackTrace:on、和 -d:memProfiler 标志编译你的应用即可。
|
=== 使用 Valgrind 进行分析
不幸的是,分析器不都是跨平台的。 Valgrind 就是一个例子, 因为它并不支持 Windows 。
Valgrind 不只是一个分析器, 它是一个主要用来调试内存和检测内存泄漏的工具。 分析器组件叫做 Callgrind,它分析你的应用调用了哪些过程,以及这些过程之后的调用,依此类推。
叫做 KCacheGrind 的应用可以把 Callgrind 的结果可视化地输出出来。
|
安装 Valgrind
要使用此处的示例,您将需要将 Valgrind 工具与 KCacheGrind 一起安装。
如果您使用的是 Linux,很有可能操作系统上已经安装了这些工具。
在 Mac OS X 上,你可以简单地通过执行下面的代码来安装
brew install valgrind QCacheGrind.
|
让我们在 listing 1.4 中列出的应用中试一下 Valgrind 吧。
首先通过运行来重新编译没有任何标志的应用程序 nim c main。
你需要注释掉 main.nim 文件中的 import nimprof 这一行,才能成功完成此操作。
然后,执行以下命令,在 Valgrind 下运行刚才的应用: valgrind --tool=callgrind -v ./main
callgrind 工具比 Nim 分析器增加了更大的开销,
因此您可能需要终止应用程序,
可以通过同时按 Control 和 C 键来安全地终止应用程序。
callgrind工具提供的文本输出非常大, 因此想直接在文本编辑器中查看所有内容是不切实际的。
Thankfully a tool exists to allow us to explore it visually. This tool is called KCacheGrind (QCacheGrind on Mac OS X). You can execute it in the directory where you executed Valgrind to get something similar to the screenshot in figure 1.3.
The results of the Callgrind tool show many more calls during the lifetime of listing 1.4. This is because many of the C functions, which have been defined by Nim, during the translation to C are now visible. These functions are necessary to implement the behaviour of the code in listing 1.4.
The C function which is selected in the screenshots corresponds to the
analyse Nim procedure. Procedures' names undergo a process called name
mangling when translated to C functions, this prevents clashes between other
C functions. The name mangling process currently just adds an underscore
followed by a number to the C function name. Thankfully figuring out which
C functions correspond to which Nim procedures is still easy.
The output from Callgrind gives you more low-level details about the execution of your Nim applications. 图 1.3 shows the number of times every single C function has been executed, it allows you to diagnose performance problems which may be outside your control. But with greater power comes greater complexity so Valgrind has a higher learning curve than the Nim profiler.
== Debugging Nim code
Debugging is one of the most important activities in software development. Bugs in software occur inadvertantly. When a user reports an issue with your software, how do you fix it?
The first step is to reproduce the issue. After that debugging tools help to diagnose the issue and to figure out its root cause.
Nim does many things to make debugging as easy as possible. For example it ensures that detailed and easy to understand stack traces are reported whenever your application crashes. Consider the following code in listing 1.6.
import strutils (1)
let line = stdin.readLine() (2)
let result = line.parseInt + 5 (3)
echo(line, " + 5 = ", result) (4)| 1 | The strutils module defines the parseInt procedure. |
| 2 | Read a line from the standard input. |
| 3 | The string line is converted into an integer, the number 5 is then
added to that integer. |
| 4 | Display the result of the calculation. |
This code is fairly simple. It reads a line of text from the standard input,
converts this line into an integer, adds the number 5 to it and displays
the result. Save this code as adder.nim and compile it by executing
nim c adder.nim, then execute the resulting binary. The program will
wait for your input, once you type in a number you will see the sum of 5
and the number you typed in. But what happens when you don’t type in a number?
Type in some text and observe the results. You should see something similar
to the output in listing 1.7 below.
ValueError exceptionTraceback (most recent call last)
adder.nim(3) adder (1)
strutils.nim parseInt (2)
Error: unhandled exception: invalid integer: some text [ValueError] (3)| 1 | The program was executing line 3 in the adder module… |
| 2 | … followed by the parseInt procedure which raised the ValueError
exception. |
| 3 | This is the exception message followed by the exception type in square brackets. |
The program crashed because an exception was raised and it was not caught
by any try statements. This resulted in a stack trace being displayed and
the program exiting. The stack trace in listing 1.7 is
very informative,
it leads directly to the line which caused the crash. After the adder.nim
module name, the number 3 points to the line number
in the adder module. This line is highlighted in
listing 1.8 below.
import strutils
let line = stdin.readLine()
let result = line.parseInt + 5
echo(line, " + 5 = ", result)The parseInt procedure cannot convert strings containing only letters
into a number because no number exists in that string. The exception message
shown at the bottom of the stack trace informs us of this. It includes
the string value that parseInt attempted to parse which gives further hints
about what went wrong.
You may not think it but program crashes are a good thing when it comes to debugging. The truly horrible bugs are the ones which produce no crashes, but instead result in your program producing incorrect results. In such cases advanced debugging techniques need to be used. Debugging also comes in handy when a stack trace does not give enough information about the issue.
The primary purpose of debugging is to investigate the state of memory
at a particular point in the execution of your program. You may for example
want to find out what the value of the line variable is just before
the parseInt procedure is called. This can be done in many ways.
=== Debugging using echo
By far the simplest and most common approach is to use the echo
procedure. The echo
procedure allows you to display the value of most variables, as long as the
type of the variable implements the $ procedure it can be displayed.
For other variables the repr procedure can be used, you can pass any
type of variable to it and get a textual representation of that
variable’s value.
Using the repr procedure and echo, let’s investigate the value of the
line variable just before the call to parseInt.
line variable using repr.import strutils
let line = stdin.readLine()
echo("The value of the line variable is: ", repr(line))
let result = line.parseInt + 5
echo(line, " + 5 = ", result)The repr procedure is useful because it shows non-printable characters
in their escaped form. It also shows extra information about many types of
data. Running the example in listing 1.9 and typing in 3 Tab
characters results in the following output.
The value of the `line` variable is: 0x105ff3050"\9\9\9"
Traceback (most recent call last)
foo.nim(4)               foo
strutils.nim             parseInt
Error: unhandled exception: invalid integer:       [ValueError]
The exception message just shows some whitespace which is how Tab characters
are shown in normal text. But you have no way of distinguishing whether
that whitespace is just normal space characters or whether it is in fact a
multiple Tab characters. The repr procedure solves this ambiguity by showing
\9\9\9, the number 9 is the ASCII number code for the tab character.
The memory address of the line variable is also shown.
A procedure marked with the {.noSideEffect.} pragma is said to have no side
effect. This means that the procedure does not modify or read any
external state, such
as changing global variables or writing to a file. Marking a procedure as
having no side effects is useful when you want this to be enforced by the
compiler, that way the code will not compile unless the procedure
remains side effect free. For example consider the following add procedure,
it is said to contain no side effects because passing the same inputs to this
procedure will always produce the same output.
add procedureproc add(a, b: int): int {.noSideEffect.} =
return a + bThis creates a problem whenever you want to debug such procedures with the
echo procedure. The echo procedure is not side effect free because it
accesses a global stdout variable. So the following code will not compile.
echo cannot be used inside a side effect free procedureproc add(a, b: int): int {.noSideEffect.} =
echo("Value of a is:", a)
return a + bCompiling the code in listing 1.11 will fail with an error:
"'add' can have side effects". Thankfully the solution is simple. Nim provides
a side effect free echo for this very purpose, it is called debugEcho so
all you need to do is replace echo with debugEcho and the code will
compile.
=== Using writeStackTrace
An unhandled exception is not the only way for a stack trace to be displayed. You may find it useful to display the current stack trace anywhere in your program for debugging purposes. This can give you vital information, especially in larger programs with many procedures, where it can show you the path through those procedures and how your program’s execution ended in a certain procedure.
Consider the following example.
writeStackTrace exampleproc a1() =
writeStackTrace()
proc a() =
a1()
a()Compiling and running this example will display the following stack trace.
Traceback (most recent call last)
foo.nim(7)               foo
foo.nim(5)               a
foo.nim(2)               a1
The a procedure is called first on line 7, followed by a1 at line 5,
and finally the writeStackTrace procedure is called on line 2.
=== Using GDB/LLDB
Sometimes a proper debugging tool is necessary for the truly complicated issues. As with profiling tools in the previous section, Nim programs can be debugged using most C debuggers. One of the most popular debugging tools is the GNU Debugger, its often known by the acronym GDB.
The GNU debugger should be included with your distribution of gcc which you should already have as part of your Nim installation. Unfortunately on the latest versions of Mac OS X installation of gdb is problematic, but you can use a similar debugger called LLDB. LLDB is a much newer debugger, but it functions in almost exactly the same way.
Let’s try to use GDB (or LLDB if you’re on Mac OS X) to debug the small
adder.nim example introduced in listing 1.8.
I will repeat the example below.
adder.nim exampleimport strutils
let line = stdin.readLine()
let result = line.parseInt + 5
echo(line, " + 5 = ", result)In order to use these debugging tools you will need to compile adder.nim
with two additional flags. The --debuginfo flag, which will instruct the
compiler to add extra debugging information to the resulting binary. The
debugging information will be used by GDB and LLDB to read procedure names
and line numbers of the currently executed code.
And also the --linedir:on flag which will include Nim-specific debug
information
such as module names and Nim source code lines. GDB and LLDB will use the
information added by the --linedir:on flag to report Nim-specific module
names and line numbers.
Putting both of these together you should compile the adder module using the
following command: nim c --debuginfo --linedir:on adder.nim.
|
The
Newer versions of Nim support the --debugger:native flag--debugger:native flag which is
equivalent to specifying the --linedir:on and --debuginfo flags.
|
The next step is to launch the debugging tool. The usage of both of these tools
is very similar. To launch the adder executable in GDB execute gdb adder
and to launch it in LLDB execute lldb adder. GDB or LLDB should launch
and you should see something similar to figure 1.4
or figure 1.5.
Once these tools are launched they will wait for input from the user.
The input is in the form of a command. Both of these tools support a range
of different commands for controlling the execution of the program, to watch
the values of specific variables, to set breakpoints and much more. To get a
full list of supported commands type in help and press enter.
The aim for this debugging session is to find out the value of the line
variable, just like in the
previous sections. To do this we need to set a breakpoint at line 3 in the
adder.nim file. Thankfully, both GDB and LLDB share the same command syntax
for creating
breakpoints. Simply type in b adder.nim:3 into the terminal and press enter.
A breakpoint should be successfully created, the debugger will confirm this
by displaying a message that is similar to 代码 5.23.
Breakpoint 1: where = adder`adderInit000 + 119 at adder.nim:3, address = 0x0000000100020f17Once the breakpoint is created, you can instruct the debugger to run the
adder program by using the run command. Type in run into the terminal
and press enter. The program won’t hit the breakpoint because it will first
read a line from standard input, so after you use the run command you will
need to type something else into the terminal. This time the adder program
will read it.
The debugger will then stop the execution of the program at line 3. Figures 1.6 and 1.7 show what that will look like.
At this point in the execution of the program, we should be able to display the
value of the line variable.
Displaying the value of a variable is the same in
both GDB and LLDB.
One can use the p (or print) command to display the value of any variable.
Unfortunately you cannot simply type in print line and get the result.
This is because of name mangling which I mentioned in the profiling section.
Before you can print out the value of the line variable you will need to
find out what the new name of it is. In almost all cases the variable name will
only have an underscore followed by a randomised number appended to it.
This makes finding the name rather trivial, but the process differs between
GDB and LLDB.
In GDB it is simple
to find out the name of the line variable, you can simply type in
print line_
and press the Tab button. GDB will then auto-complete the name for you, or give
you a list of choices.
As for LLDB, because it does not support auto-complete via the Tab key, this
is a bit more complicated. You need to find the name of the variable by looking
at the list of local and global variables in the current scope. You can get
a list of local variables by using the fr v -a
(or frame variable --no-args) command, and a list of global variables
by using the ta v (or target variable) command. The line variable is
a global variable so type in ta v to get a list of the global variables.
You should see something similar to the screenshot in figure 1.8.
You can see the line variable at the bottom of the list as line_106004.
Now print the line variable by using the print <var_name_here> command,
make sure to replace the <var_name_here> with the name of the line variable
that you found from the previous step. Figures 1.9 and
1.10 show what you may see.
line variable in GDB
line variable in LLDBThis unfortunately tells us nothing about the value of the line variable.
We are in the land of low-level C, so the line variable is a pointer to
a NimStringDesc type. We can dereference this pointer by appending an
asterisk to the beginning of the variable name: print *line_106004.
Doing this will show values of each of the fields in the NimStringDesc
type. Unfortunately in LLDB this does not show the value of the data field,
so we must explicitly access it: print (char*)line_106004->data. The
(char*) is required to cast the data field into something which LLDB
can display. Figures 1.11 and 1.12
show what this looks like in GDB and LLDB respectively.
line variable in GDB
line variable in LLDBThis is much more complicated than simply using the echo procedure, but should
be useful for more complicated debugging scenarios. Hopefully this gave you
an idea of how to compile your Nim program so that it can
be debugged using GDB and LLDB. There are many more features that
these debuggers provide which are beyond the scope of this article. These
features allow you to analyse the execution of your program in many other
ways. You may wish
to learn more by looking at the many resources available online for these
debuggers and many others.
== Conclusion
Thank you for reading. If you require help with these topics or anything else related to Nim, be sure to get in touch with our community.